Immigrants from Caribbean vs Immigrants from Indonesia No Vehicles in Household
COMPARE
Immigrants from Caribbean
Immigrants from Indonesia
No Vehicles in Household
No Vehicles in Household Comparison
Immigrants from Caribbean
Immigrants from Indonesia
19.6%
NO VEHICLES IN HOUSEHOLD
0.0/ 100
METRIC RATING
324th/ 347
METRIC RANK
10.1%
NO VEHICLES IN HOUSEHOLD
69.3/ 100
METRIC RATING
159th/ 347
METRIC RANK
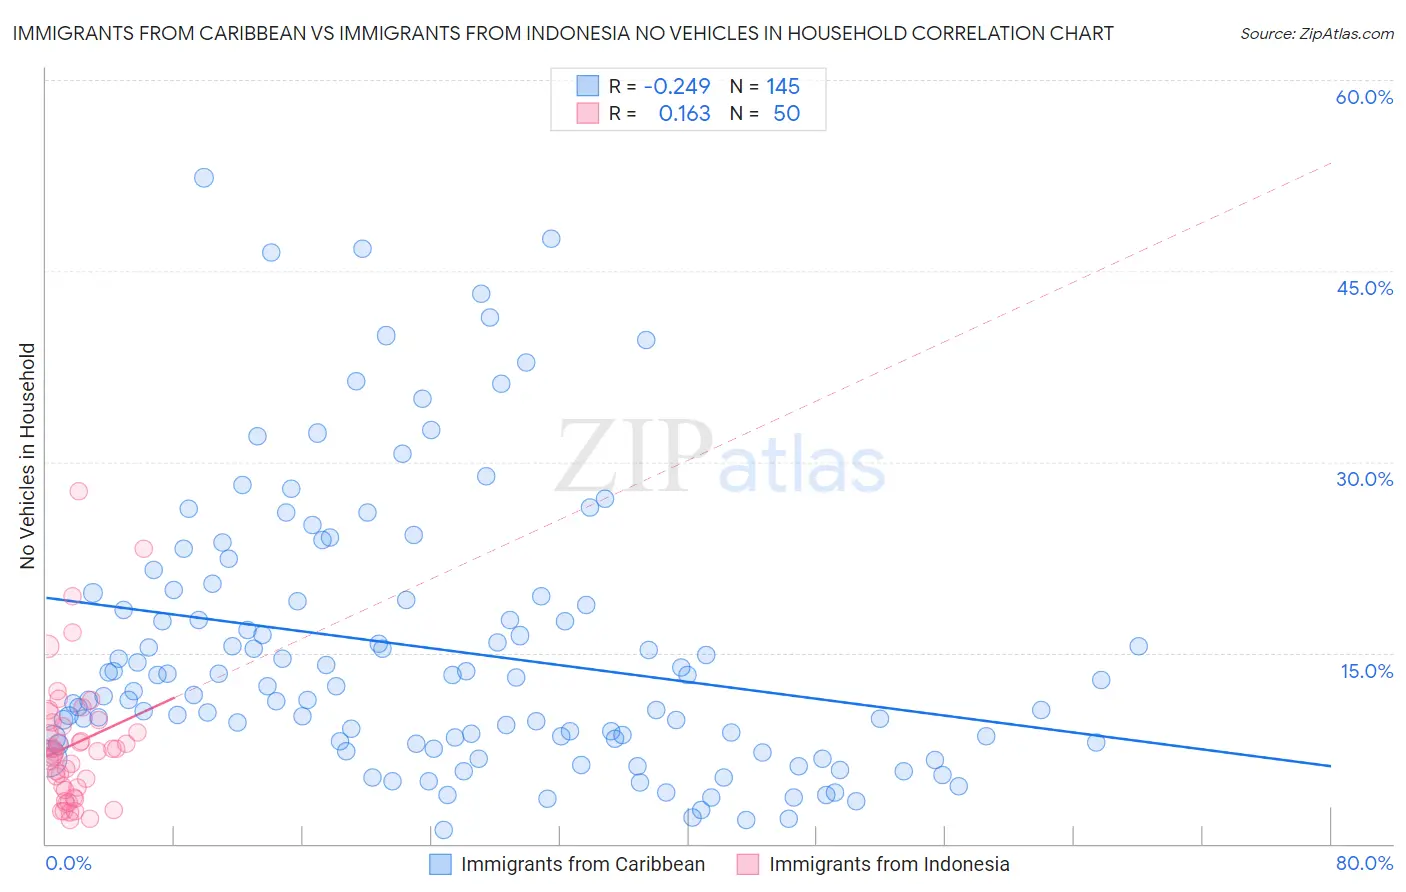
Immigrants from Caribbean vs Immigrants from Indonesia No Vehicles in Household Correlation Chart
The statistical analysis conducted on geographies consisting of 448,573,126 people shows a weak negative correlation between the proportion of Immigrants from Caribbean and percentage of households with no vehicle available in the United States with a correlation coefficient (R) of -0.249 and weighted average of 19.6%. Similarly, the statistical analysis conducted on geographies consisting of 215,406,019 people shows a poor positive correlation between the proportion of Immigrants from Indonesia and percentage of households with no vehicle available in the United States with a correlation coefficient (R) of 0.163 and weighted average of 10.1%, a difference of 93.9%.
No Vehicles in Household Correlation Summary
| Measurement | Immigrants from Caribbean | Immigrants from Indonesia |
| Minimum | 1.0% | 1.9% |
| Maximum | 52.3% | 27.7% |
| Range | 51.3% | 25.8% |
| Mean | 15.3% | 7.8% |
| Median | 12.4% | 7.2% |
| Interquartile 25% (IQ1) | 8.0% | 4.3% |
| Interquartile 75% (IQ3) | 19.3% | 9.5% |
| Interquartile Range (IQR) | 11.3% | 5.2% |
| Standard Deviation (Sample) | 10.8% | 5.2% |
| Standard Deviation (Population) | 10.8% | 5.2% |
Similar Demographics by No Vehicles in Household
Demographics Similar to Immigrants from Caribbean by No Vehicles in Household
In terms of no vehicles in household, the demographic groups most similar to Immigrants from Caribbean are Senegalese (19.8%, a difference of 0.72%), Immigrants from Yemen (19.5%, a difference of 0.73%), Immigrants from West Indies (20.5%, a difference of 4.7%), Immigrants from Cabo Verde (18.4%, a difference of 6.3%), and Immigrants from Senegal (21.1%, a difference of 7.8%).
| Demographics | Rating | Rank | No Vehicles in Household |
| Immigrants | Ghana | 0.0 /100 | #317 | Tragic 16.6% |
| Immigrants | Belarus | 0.0 /100 | #318 | Tragic 16.7% |
| Alaska Natives | 0.0 /100 | #319 | Tragic 17.4% |
| Soviet Union | 0.0 /100 | #320 | Tragic 17.4% |
| Jamaicans | 0.0 /100 | #321 | Tragic 17.9% |
| Immigrants | Cabo Verde | 0.0 /100 | #322 | Tragic 18.4% |
| Immigrants | Yemen | 0.0 /100 | #323 | Tragic 19.5% |
| Immigrants | Caribbean | 0.0 /100 | #324 | Tragic 19.6% |
| Senegalese | 0.0 /100 | #325 | Tragic 19.8% |
| Immigrants | West Indies | 0.0 /100 | #326 | Tragic 20.5% |
| Immigrants | Senegal | 0.0 /100 | #327 | Tragic 21.1% |
| Immigrants | Dominica | 0.0 /100 | #328 | Tragic 22.2% |
| Ecuadorians | 0.0 /100 | #329 | Tragic 22.8% |
| West Indians | 0.0 /100 | #330 | Tragic 23.7% |
| Trinidadians and Tobagonians | 0.0 /100 | #331 | Tragic 23.7% |
Demographics Similar to Immigrants from Indonesia by No Vehicles in Household
In terms of no vehicles in household, the demographic groups most similar to Immigrants from Indonesia are Spanish American Indian (10.1%, a difference of 0.15%), Australian (10.1%, a difference of 0.21%), Immigrants from Micronesia (10.1%, a difference of 0.26%), Salvadoran (10.1%, a difference of 0.51%), and Sioux (10.1%, a difference of 0.52%).
| Demographics | Rating | Rank | No Vehicles in Household |
| Immigrants | Congo | 73.0 /100 | #152 | Good 10.1% |
| Tlingit-Haida | 72.5 /100 | #153 | Good 10.1% |
| Sioux | 72.4 /100 | #154 | Good 10.1% |
| Salvadorans | 72.4 /100 | #155 | Good 10.1% |
| Immigrants | Micronesia | 70.9 /100 | #156 | Good 10.1% |
| Australians | 70.6 /100 | #157 | Good 10.1% |
| Spanish American Indians | 70.2 /100 | #158 | Good 10.1% |
| Immigrants | Indonesia | 69.3 /100 | #159 | Good 10.1% |
| Immigrants | Middle Africa | 65.7 /100 | #160 | Good 10.2% |
| New Zealanders | 65.1 /100 | #161 | Good 10.2% |
| Immigrants | Austria | 64.4 /100 | #162 | Good 10.2% |
| Immigrants | Cambodia | 63.7 /100 | #163 | Good 10.2% |
| South Africans | 61.1 /100 | #164 | Good 10.2% |
| Comanche | 60.8 /100 | #165 | Good 10.2% |
| Immigrants | Costa Rica | 60.5 /100 | #166 | Good 10.3% |