Peruvian vs Sudanese 2 or more Vehicles in Household
COMPARE
Peruvian
Sudanese
2 or more Vehicles in Household
2 or more Vehicles in Household Comparison
Peruvians
Sudanese
55.0%
2 OR MORE VEHICLES IN HOUSEHOLD
33.7/ 100
METRIC RATING
186th/ 347
METRIC RANK
53.6%
2 OR MORE VEHICLES IN HOUSEHOLD
4.1/ 100
METRIC RATING
227th/ 347
METRIC RANK
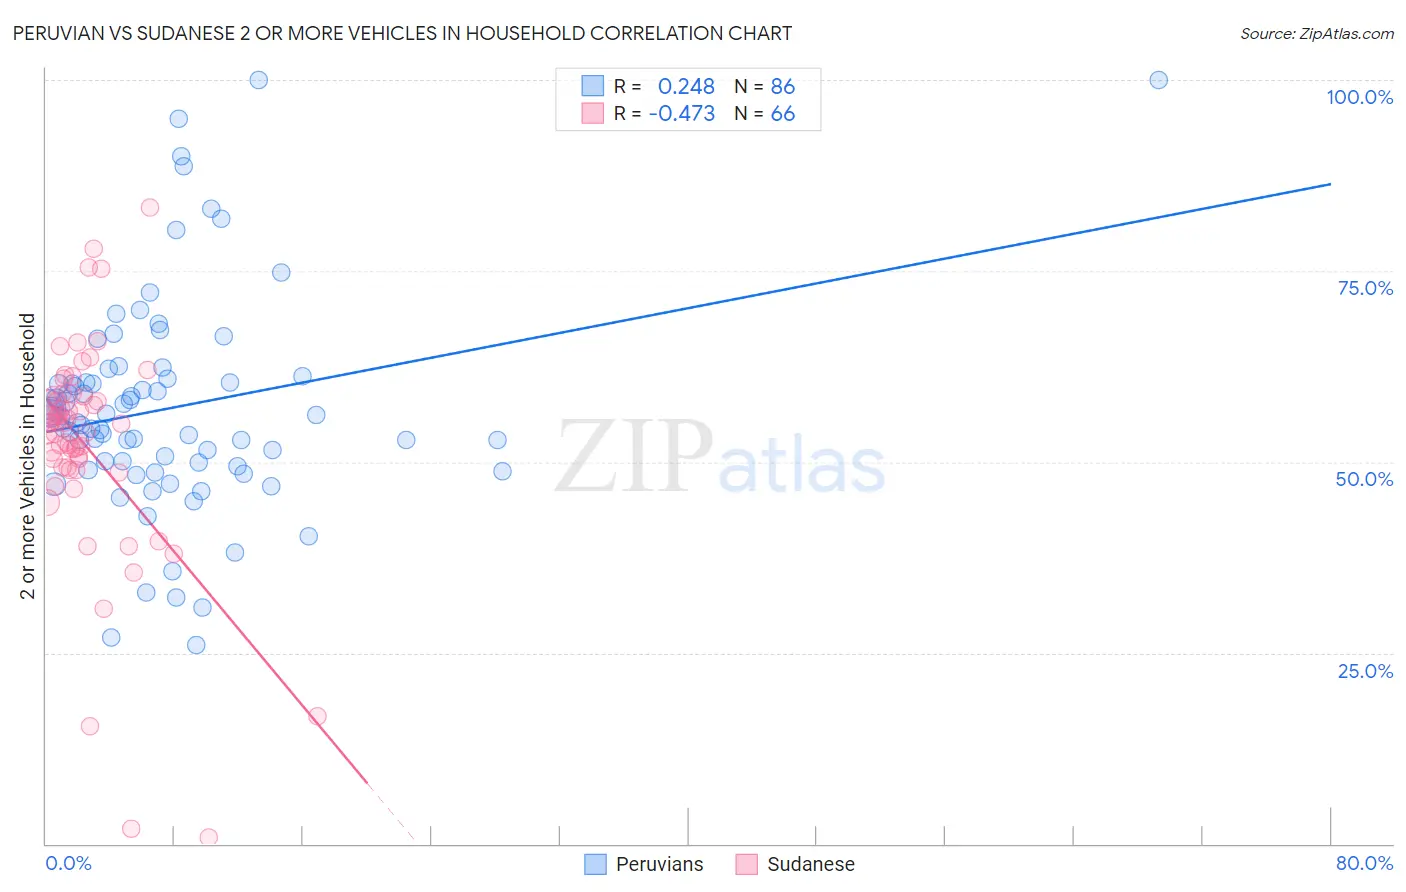
Peruvian vs Sudanese 2 or more Vehicles in Household Correlation Chart
The statistical analysis conducted on geographies consisting of 363,025,194 people shows a weak positive correlation between the proportion of Peruvians and percentage of households with 2 or more vehicles available in the United States with a correlation coefficient (R) of 0.248 and weighted average of 55.0%. Similarly, the statistical analysis conducted on geographies consisting of 110,122,172 people shows a moderate negative correlation between the proportion of Sudanese and percentage of households with 2 or more vehicles available in the United States with a correlation coefficient (R) of -0.473 and weighted average of 53.6%, a difference of 2.5%.
2 or more Vehicles in Household Correlation Summary
| Measurement | Peruvian | Sudanese |
| Minimum | 26.0% | 0.83% |
| Maximum | 100.0% | 83.4% |
| Range | 74.0% | 82.5% |
| Mean | 57.1% | 52.1% |
| Median | 55.6% | 55.1% |
| Interquartile 25% (IQ1) | 49.4% | 49.2% |
| Interquartile 75% (IQ3) | 60.9% | 58.6% |
| Interquartile Range (IQR) | 11.5% | 9.4% |
| Standard Deviation (Sample) | 14.3% | 14.5% |
| Standard Deviation (Population) | 14.2% | 14.4% |
Similar Demographics by 2 or more Vehicles in Household
Demographics Similar to Peruvians by 2 or more Vehicles in Household
In terms of 2 or more vehicles in household, the demographic groups most similar to Peruvians are Immigrants from Uganda (55.0%, a difference of 0.010%), Arab (55.0%, a difference of 0.10%), Apache (55.1%, a difference of 0.13%), Marshallese (54.9%, a difference of 0.15%), and Immigrants from Cameroon (55.1%, a difference of 0.16%).
| Demographics | Rating | Rank | 2 or more Vehicles in Household |
| Alaskan Athabascans | 42.9 /100 | #179 | Average 55.2% |
| Immigrants | Kenya | 40.4 /100 | #180 | Average 55.1% |
| Immigrants | Micronesia | 38.2 /100 | #181 | Fair 55.1% |
| Cree | 38.2 /100 | #182 | Fair 55.1% |
| Immigrants | Cameroon | 37.3 /100 | #183 | Fair 55.1% |
| Apache | 36.7 /100 | #184 | Fair 55.1% |
| Arabs | 35.9 /100 | #185 | Fair 55.0% |
| Peruvians | 33.7 /100 | #186 | Fair 55.0% |
| Immigrants | Uganda | 33.4 /100 | #187 | Fair 55.0% |
| Marshallese | 30.5 /100 | #188 | Fair 54.9% |
| Eastern Europeans | 27.5 /100 | #189 | Fair 54.8% |
| Russians | 26.3 /100 | #190 | Fair 54.8% |
| Immigrants | Immigrants | 25.0 /100 | #191 | Fair 54.7% |
| Immigrants | Romania | 23.8 /100 | #192 | Fair 54.7% |
| Immigrants | Japan | 23.4 /100 | #193 | Fair 54.7% |
Demographics Similar to Sudanese by 2 or more Vehicles in Household
In terms of 2 or more vehicles in household, the demographic groups most similar to Sudanese are Alaska Native (53.6%, a difference of 0.060%), Immigrants from Turkey (53.6%, a difference of 0.080%), Immigrants from Nepal (53.5%, a difference of 0.14%), Panamanian (53.5%, a difference of 0.19%), and Immigrants from Eastern Africa (53.7%, a difference of 0.24%).
| Demographics | Rating | Rank | 2 or more Vehicles in Household |
| Taiwanese | 6.3 /100 | #220 | Tragic 53.9% |
| Immigrants | Singapore | 6.3 /100 | #221 | Tragic 53.9% |
| Kiowa | 6.2 /100 | #222 | Tragic 53.9% |
| Immigrants | Bosnia and Herzegovina | 5.5 /100 | #223 | Tragic 53.8% |
| Brazilians | 5.3 /100 | #224 | Tragic 53.8% |
| Immigrants | Egypt | 5.2 /100 | #225 | Tragic 53.8% |
| Immigrants | Eastern Africa | 5.1 /100 | #226 | Tragic 53.7% |
| Sudanese | 4.1 /100 | #227 | Tragic 53.6% |
| Alaska Natives | 3.9 /100 | #228 | Tragic 53.6% |
| Immigrants | Turkey | 3.8 /100 | #229 | Tragic 53.6% |
| Immigrants | Nepal | 3.6 /100 | #230 | Tragic 53.5% |
| Panamanians | 3.4 /100 | #231 | Tragic 53.5% |
| Immigrants | Guatemala | 3.2 /100 | #232 | Tragic 53.5% |
| Ugandans | 3.2 /100 | #233 | Tragic 53.5% |
| Immigrants | Switzerland | 3.0 /100 | #234 | Tragic 53.4% |