Immigrants from Indonesia vs Lithuanian 2 or more Vehicles in Household

COMPARE

Immigrants from Indonesia
Race
Ancestry
AfghanAfricanAlaska NativeAlaskan AthabascanAlbanianAleutAlsatianAmericanApacheArabArapahoArgentineanArmenianAssyrian/Chaldean/SyriacAustralianAustrianBahamianBangladeshiBarbadianBasqueBelgianBelizeanBermudanBhutaneseBlackfeetBolivianBrazilianBritishBritish West IndianBulgarianBurmeseCajunCambodianCanadianCape VerdeanCarpatho RusynCelticCentral AmericanCentral American IndianCherokeeCheyenneChickasawChileanChineseChippewaChoctawColombianColvilleComancheCosta RicanCreeCreekCroatianCrowCubanCypriotCzechCzechoslovakianDanishDelawareDominicanDutchDutch West IndianEastern EuropeanEcuadorianEgyptianEnglishEstonianEthiopianEuropeanFijianFilipinoFinnishFrenchFrench American IndianFrench CanadianGermanGerman RussianGhanaianGreekGuamanian/ChamorroGuatemalanGuyaneseHaitianHmongHonduranHopiHoumaHungarianIcelanderIndian (Asian)IndonesianInupiatIranianIraqiIrishIroquoisIsraeliItalianJamaicanJapaneseJordanianKenyanKiowaKoreanLaotianLatvianLebaneseLiberianLumbeeLuxembourgerMacedonianMalaysianMalteseMarshalleseMenomineeMexicanMexican American IndianMongolianMoroccanNative HawaiianNavajoNepaleseNew ZealanderNicaraguanNigerianNorthern EuropeanNorwegianOkinawanOsageOttawaPaiutePakistaniPalestinianPanamanianParaguayanPennsylvania GermanPeruvianPimaPolishPortuguesePotawatomiPuebloPuerto RicanPuget Sound SalishRomanianRussianSalvadoranSamoanScandinavianScotch-IrishScottishSeminoleSenegaleseSerbianShoshoneSierra LeoneanSiouxSlavicSlovakSloveneSomaliSouth AfricanSouth AmericanSouth American IndianSoviet UnionSpaniardSpanishSpanish AmericanSpanish American IndianSri LankanSubsaharan AfricanSudaneseSwedishSwissSyrianTaiwaneseThaiTlingit-HaidaTohono O'OdhamTonganTrinidadian and TobagonianTsimshianTurkishU.S. Virgin IslanderUgandanUkrainianUruguayanUteVenezuelanVietnameseWelshWest IndianYakamaYaquiYugoslavianYumanYup'ikZimbabwean
Immigration
NonimmigrantsImmigrantsAfghanistanAfricaAlbaniaArgentinaArmeniaAsiaAustraliaAustriaBahamasBangladeshBarbadosBelarusBelgiumBelizeBoliviaBosnia and HerzegovinaBrazilBulgariaBurma/MyanmarCabo VerdeCambodiaCameroonCanadaCaribbeanCentral AmericaChileChinaColombiaCongoCosta RicaCroatiaCubaCzechoslovakiaDenmarkDominicaDominican RepublicEastern AfricaEastern AsiaEastern EuropeEcuadorEgyptEl SalvadorEnglandEritreaEthiopiaEuropeFijiFranceGermanyGhanaGreeceGrenadaGuatemalaGuyanaHaitiHondurasHong KongHungaryIndiaIndonesiaIranIraqIrelandIsraelItalyJamaicaJapanJordanKazakhstanKenyaKoreaKuwaitLaosLatin AmericaLatviaLebanonLiberiaLithuaniaMalaysiaMexicoMicronesiaMiddle AfricaMoldovaMoroccoNepalNetherlandsNicaraguaNigeriaNorth AmericaNorth MacedoniaNorthern AfricaNorthern EuropeNorwayOceaniaPakistanPanamaPeruPhilippinesPolandPortugalRomaniaRussiaSaudi ArabiaScotlandSenegalSerbiaSierra LeoneSingaporeSomaliaSouth AfricaSouth AmericaSouth Central AsiaSouth Eastern AsiaSouthern EuropeSpainSri LankaSt. Vincent and the GrenadinesSudanSwedenSwitzerlandSyriaTaiwanThailandTrinidad and TobagoTurkeyUgandaUkraineUruguayUzbekistanVenezuelaVietnamWest IndiesWestern AfricaWestern AsiaWestern EuropeYemenZaireZimbabweAzores
Lithuanian
Race
Ancestry
AfghanAfricanAlaska NativeAlaskan AthabascanAlbanianAleutAlsatianAmericanApacheArabArapahoArgentineanArmenianAssyrian/Chaldean/SyriacAustralianAustrianBahamianBangladeshiBarbadianBasqueBelgianBelizeanBermudanBhutaneseBlackfeetBolivianBrazilianBritishBritish West IndianBulgarianBurmeseCajunCambodianCanadianCape VerdeanCarpatho RusynCelticCentral AmericanCentral American IndianCherokeeCheyenneChickasawChileanChineseChippewaChoctawColombianColvilleComancheCosta RicanCreeCreekCroatianCrowCubanCypriotCzechCzechoslovakianDanishDelawareDominicanDutchDutch West IndianEastern EuropeanEcuadorianEgyptianEnglishEstonianEthiopianEuropeanFijianFilipinoFinnishFrenchFrench American IndianFrench CanadianGermanGerman RussianGhanaianGreekGuamanian/ChamorroGuatemalanGuyaneseHaitianHmongHonduranHopiHoumaHungarianIcelanderIndian (Asian)IndonesianInupiatIranianIraqiIrishIroquoisIsraeliItalianJamaicanJapaneseJordanianKenyanKiowaKoreanLaotianLatvianLebaneseLiberianLithuanianLumbeeLuxembourgerMacedonianMalaysianMalteseMarshalleseMenomineeMexicanMexican American IndianMongolianMoroccanNative HawaiianNavajoNepaleseNew ZealanderNicaraguanNigerianNorthern EuropeanNorwegianOkinawanOsageOttawaPaiutePakistaniPalestinianPanamanianParaguayanPennsylvania GermanPeruvianPimaPolishPortuguesePotawatomiPuebloPuerto RicanPuget Sound SalishRomanianRussianSalvadoranSamoanScandinavianScotch-IrishScottishSeminoleSenegaleseSerbianShoshoneSierra LeoneanSiouxSlavicSlovakSloveneSomaliSouth AfricanSouth AmericanSouth American IndianSoviet UnionSpaniardSpanishSpanish AmericanSpanish American IndianSri LankanSubsaharan AfricanSudaneseSwedishSwissSyrianTaiwaneseThaiTlingit-HaidaTohono O'OdhamTonganTrinidadian and TobagonianTsimshianTurkishU.S. Virgin IslanderUgandanUkrainianUruguayanUteVenezuelanVietnameseWelshWest IndianYakamaYaquiYugoslavianYumanYup'ikZimbabwean
Immigration
NonimmigrantsImmigrantsAfghanistanAfricaAlbaniaArgentinaArmeniaAsiaAustraliaAustriaBahamasBangladeshBarbadosBelarusBelgiumBelizeBoliviaBosnia and HerzegovinaBrazilBulgariaBurma/MyanmarCabo VerdeCambodiaCameroonCanadaCaribbeanCentral AmericaChileChinaColombiaCongoCosta RicaCroatiaCubaCzechoslovakiaDenmarkDominicaDominican RepublicEastern AfricaEastern AsiaEastern EuropeEcuadorEgyptEl SalvadorEnglandEritreaEthiopiaEuropeFijiFranceGermanyGhanaGreeceGrenadaGuatemalaGuyanaHaitiHondurasHong KongHungaryIndiaIranIraqIrelandIsraelItalyJamaicaJapanJordanKazakhstanKenyaKoreaKuwaitLaosLatin AmericaLatviaLebanonLiberiaLithuaniaMalaysiaMexicoMicronesiaMiddle AfricaMoldovaMoroccoNepalNetherlandsNicaraguaNigeriaNorth AmericaNorth MacedoniaNorthern AfricaNorthern EuropeNorwayOceaniaPakistanPanamaPeruPhilippinesPolandPortugalRomaniaRussiaSaudi ArabiaScotlandSenegalSerbiaSierra LeoneSingaporeSomaliaSouth AfricaSouth AmericaSouth Central AsiaSouth Eastern AsiaSouthern EuropeSpainSri LankaSt. Vincent and the GrenadinesSudanSwedenSwitzerlandSyriaTaiwanThailandTrinidad and TobagoTurkeyUgandaUkraineUruguayUzbekistanVenezuelaVietnamWest IndiesWestern AfricaWestern AsiaWestern EuropeYemenZaireZimbabweAzores
2 or more Vehicles in Household
Income
Poverty
Unemployment
Labor Participation
Family Structure
Vehicle Availability
Education Level
Disability

2 or more Vehicles in Household Comparison

Immigrants from Indonesia

Lithuanians

Exceptional
Exceptional
57.6%
2 OR MORE VEHICLES IN HOUSEHOLD
98.2/ 100
METRIC RATING
104th/ 347
METRIC RANK
58.2%
2 OR MORE VEHICLES IN HOUSEHOLD
99.5/ 100
METRIC RATING
78th/ 347
METRIC RANK

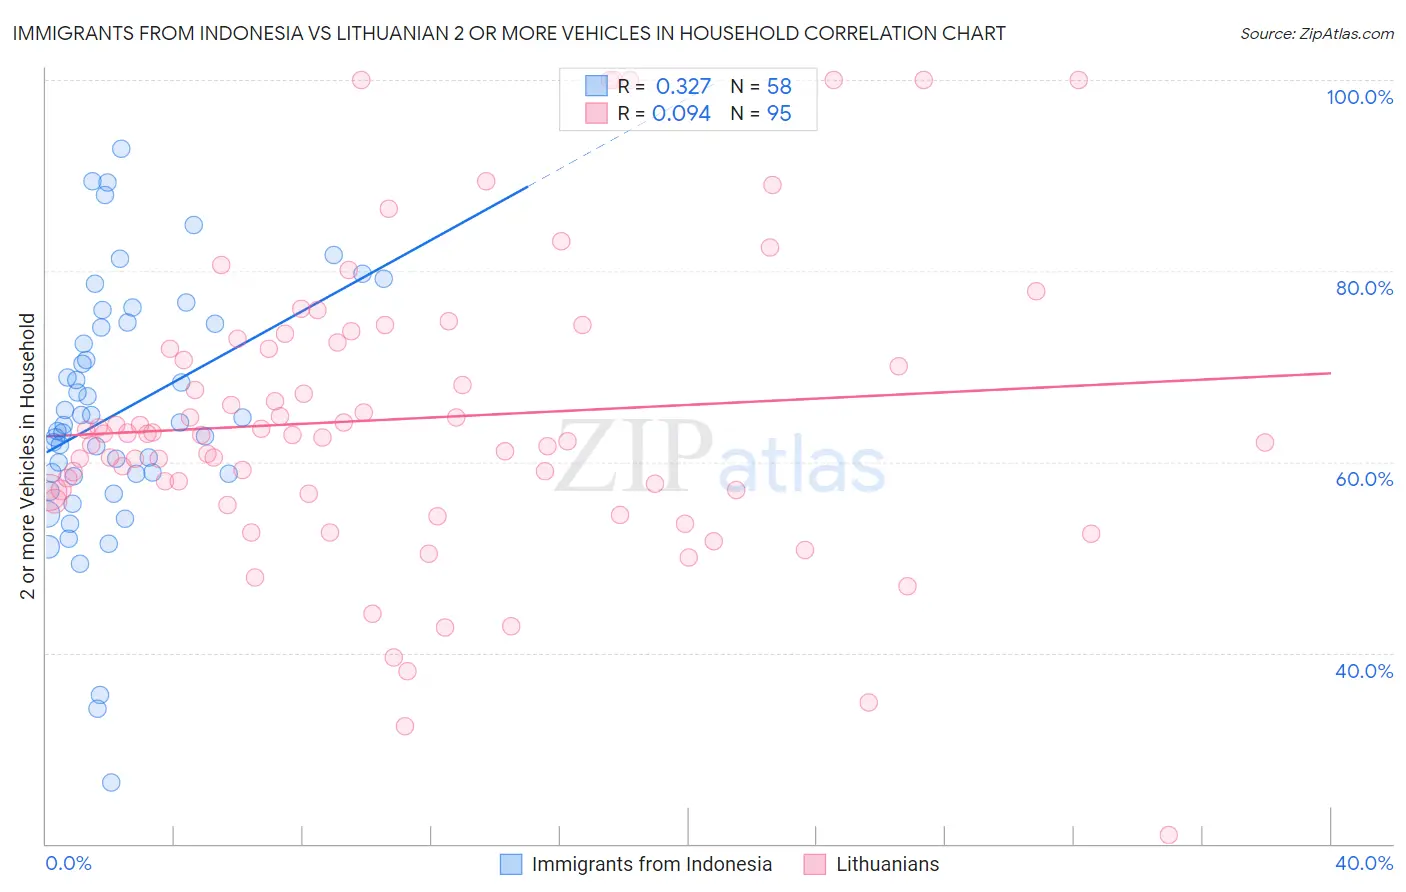
Immigrants from Indonesia vs Lithuanian 2 or more Vehicles in Household Correlation Chart

The statistical analysis conducted on geographies consisting of 215,617,231 people shows a mild positive correlation between the proportion of Immigrants from Indonesia and percentage of households with 2 or more vehicles available in the United States with a correlation coefficient (R) of 0.327 and weighted average of 57.6%. Similarly, the statistical analysis conducted on geographies consisting of 421,771,699 people shows a slight positive correlation between the proportion of Lithuanians and percentage of households with 2 or more vehicles available in the United States with a correlation coefficient (R) of 0.094 and weighted average of 58.2%, a difference of 1.2%.
Immigrants from Indonesia vs Lithuanian 2 or more Vehicles in Household

2 or more Vehicles in Household Correlation Summary

MeasurementImmigrants from IndonesiaLithuanian
Minimum26.4%20.9%
Maximum92.7%100.0%
Range66.4%79.1%
Mean65.2%64.5%
Median64.0%62.8%
Interquartile 25% (IQ1)58.7%56.8%
Interquartile 75% (IQ3)74.4%72.5%
Interquartile Range (IQR)15.7%15.7%
Standard Deviation (Sample)13.1%15.4%
Standard Deviation (Population)13.0%15.4%

Similar Demographics by 2 or more Vehicles in Household

Demographics Similar to Immigrants from Indonesia by 2 or more Vehicles in Household

In terms of 2 or more vehicles in household, the demographic groups most similar to Immigrants from Indonesia are Immigrants from Bolivia (57.6%, a difference of 0.0%), Jordanian (57.6%, a difference of 0.0%), Immigrants from Korea (57.6%, a difference of 0.0%), Immigrants from Oceania (57.5%, a difference of 0.020%), and Immigrants from Netherlands (57.5%, a difference of 0.040%).
DemographicsRating | Rank2 or more Vehicles in Household
Slavs
98.8
/100
|
#97
Exceptional
57.8%
Palestinians
98.6
/100
|
#98
Exceptional
57.7%
Cajuns
98.5
/100
|
#99
Exceptional
57.7%
Fijians
98.4
/100
|
#100
Exceptional
57.6%
Lebanese
98.3
/100
|
#101
Exceptional
57.6%
Immigrants | Bolivia
98.2
/100
|
#102
Exceptional
57.6%
Jordanians
98.2
/100
|
#103
Exceptional
57.6%
Immigrants | Indonesia
98.2
/100
|
#104
Exceptional
57.6%
Immigrants | Korea
98.2
/100
|
#105
Exceptional
57.6%
Immigrants | Oceania
98.2
/100
|
#106
Exceptional
57.5%
Immigrants | Netherlands
98.2
/100
|
#107
Exceptional
57.5%
Immigrants | Canada
98.1
/100
|
#108
Exceptional
57.5%
Immigrants | North America
98.1
/100
|
#109
Exceptional
57.5%
Japanese
98.0
/100
|
#110
Exceptional
57.5%
Greeks
98.0
/100
|
#111
Exceptional
57.5%

Demographics Similar to Lithuanians by 2 or more Vehicles in Household

In terms of 2 or more vehicles in household, the demographic groups most similar to Lithuanians are Slovene (58.3%, a difference of 0.050%), Creek (58.3%, a difference of 0.060%), Delaware (58.2%, a difference of 0.080%), Polish (58.3%, a difference of 0.10%), and Immigrants from Afghanistan (58.3%, a difference of 0.17%).
DemographicsRating | Rank2 or more Vehicles in Household
Bangladeshis
99.6
/100
|
#71
Exceptional
58.4%
Austrians
99.6
/100
|
#72
Exceptional
58.4%
Bolivians
99.6
/100
|
#73
Exceptional
58.3%
Immigrants | Afghanistan
99.6
/100
|
#74
Exceptional
58.3%
Poles
99.5
/100
|
#75
Exceptional
58.3%
Creek
99.5
/100
|
#76
Exceptional
58.3%
Slovenes
99.5
/100
|
#77
Exceptional
58.3%
Lithuanians
99.5
/100
|
#78
Exceptional
58.2%
Delaware
99.4
/100
|
#79
Exceptional
58.2%
Immigrants | England
99.3
/100
|
#80
Exceptional
58.1%
Immigrants | Iraq
99.3
/100
|
#81
Exceptional
58.1%
Iranians
99.3
/100
|
#82
Exceptional
58.1%
Icelanders
99.2
/100
|
#83
Exceptional
58.0%
Maltese
99.2
/100
|
#84
Exceptional
58.0%
Slovaks
99.2
/100
|
#85
Exceptional
58.0%