Israeli vs Immigrants from Lithuania Unemployment Among Women with Children Under 18 years
COMPARE
Israeli
Immigrants from Lithuania
Unemployment Among Women with Children Under 18 years
Unemployment Among Women with Children Under 18 years Comparison
Israelis
Immigrants from Lithuania
5.6%
UNEMPLOYMENT AMONG WOMEN WITH CHILDREN UNDER 18 YEARS
15.6/ 100
METRIC RATING
204th/ 347
METRIC RANK
5.2%
UNEMPLOYMENT AMONG WOMEN WITH CHILDREN UNDER 18 YEARS
95.4/ 100
METRIC RATING
81st/ 347
METRIC RANK
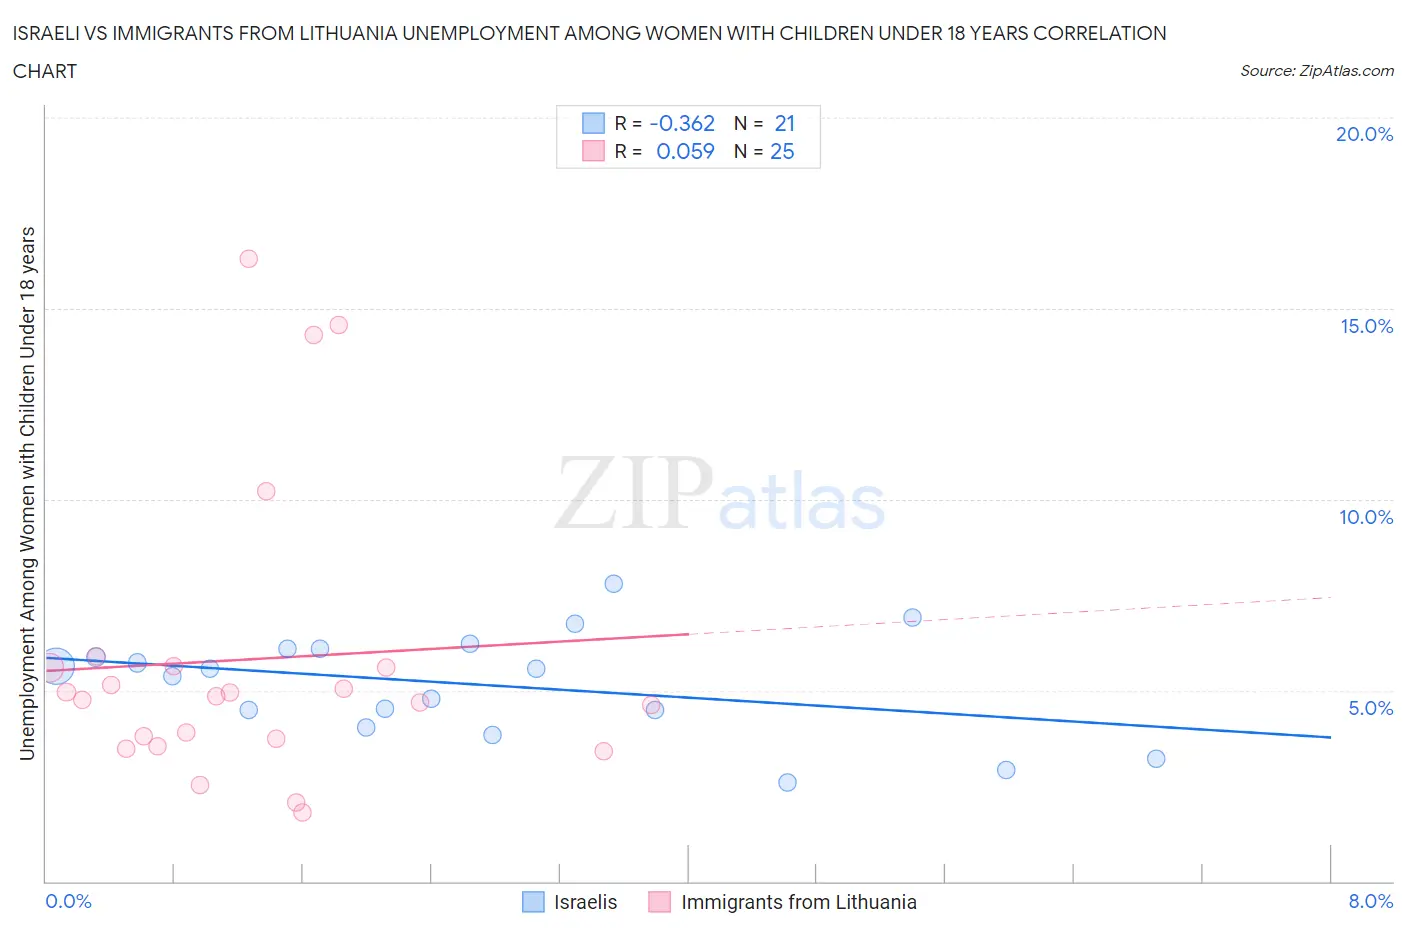
Israeli vs Immigrants from Lithuania Unemployment Among Women with Children Under 18 years Correlation Chart
The statistical analysis conducted on geographies consisting of 206,692,702 people shows a mild negative correlation between the proportion of Israelis and unemployment rate among women with children under the age of 18 in the United States with a correlation coefficient (R) of -0.362 and weighted average of 5.6%. Similarly, the statistical analysis conducted on geographies consisting of 115,897,775 people shows a slight positive correlation between the proportion of Immigrants from Lithuania and unemployment rate among women with children under the age of 18 in the United States with a correlation coefficient (R) of 0.059 and weighted average of 5.2%, a difference of 8.9%.
Unemployment Among Women with Children Under 18 years Correlation Summary
| Measurement | Israeli | Immigrants from Lithuania |
| Minimum | 2.6% | 1.8% |
| Maximum | 7.8% | 16.3% |
| Range | 5.2% | 14.5% |
| Mean | 5.2% | 5.8% |
| Median | 5.5% | 4.8% |
| Interquartile 25% (IQ1) | 4.2% | 3.6% |
| Interquartile 75% (IQ3) | 6.1% | 5.6% |
| Interquartile Range (IQR) | 1.8% | 2.0% |
| Standard Deviation (Sample) | 1.4% | 3.8% |
| Standard Deviation (Population) | 1.3% | 3.8% |
Similar Demographics by Unemployment Among Women with Children Under 18 years
Demographics Similar to Israelis by Unemployment Among Women with Children Under 18 years
In terms of unemployment among women with children under 18 years, the demographic groups most similar to Israelis are Portuguese (5.6%, a difference of 0.030%), Tsimshian (5.6%, a difference of 0.050%), Immigrants from Micronesia (5.6%, a difference of 0.18%), Immigrants from Morocco (5.6%, a difference of 0.27%), and Menominee (5.6%, a difference of 0.36%).
| Demographics | Rating | Rank | Unemployment Among Women with Children Under 18 years |
| Immigrants | Colombia | 21.4 /100 | #197 | Fair 5.6% |
| Arabs | 21.4 /100 | #198 | Fair 5.6% |
| Marshallese | 20.2 /100 | #199 | Fair 5.6% |
| Menominee | 18.6 /100 | #200 | Poor 5.6% |
| Immigrants | Morocco | 17.9 /100 | #201 | Poor 5.6% |
| Immigrants | Micronesia | 17.1 /100 | #202 | Poor 5.6% |
| Portuguese | 15.9 /100 | #203 | Poor 5.6% |
| Israelis | 15.6 /100 | #204 | Poor 5.6% |
| Tsimshian | 15.2 /100 | #205 | Poor 5.6% |
| Nicaraguans | 12.3 /100 | #206 | Poor 5.6% |
| Peruvians | 12.1 /100 | #207 | Poor 5.6% |
| Immigrants | Costa Rica | 11.6 /100 | #208 | Poor 5.6% |
| Immigrants | Western Asia | 11.3 /100 | #209 | Poor 5.6% |
| Immigrants | Nonimmigrants | 10.6 /100 | #210 | Poor 5.7% |
| Panamanians | 10.1 /100 | #211 | Poor 5.7% |
Demographics Similar to Immigrants from Lithuania by Unemployment Among Women with Children Under 18 years
In terms of unemployment among women with children under 18 years, the demographic groups most similar to Immigrants from Lithuania are Bolivian (5.1%, a difference of 0.040%), Romanian (5.2%, a difference of 0.050%), Immigrants from Croatia (5.1%, a difference of 0.090%), Assyrian/Chaldean/Syriac (5.1%, a difference of 0.11%), and Zimbabwean (5.1%, a difference of 0.13%).
| Demographics | Rating | Rank | Unemployment Among Women with Children Under 18 years |
| Immigrants | Northern Europe | 95.9 /100 | #74 | Exceptional 5.1% |
| Immigrants | Asia | 95.8 /100 | #75 | Exceptional 5.1% |
| Puget Sound Salish | 95.8 /100 | #76 | Exceptional 5.1% |
| Zimbabweans | 95.7 /100 | #77 | Exceptional 5.1% |
| Assyrians/Chaldeans/Syriacs | 95.7 /100 | #78 | Exceptional 5.1% |
| Immigrants | Croatia | 95.6 /100 | #79 | Exceptional 5.1% |
| Bolivians | 95.5 /100 | #80 | Exceptional 5.1% |
| Immigrants | Lithuania | 95.4 /100 | #81 | Exceptional 5.2% |
| Romanians | 95.3 /100 | #82 | Exceptional 5.2% |
| Maltese | 95.1 /100 | #83 | Exceptional 5.2% |
| Australians | 95.1 /100 | #84 | Exceptional 5.2% |
| Paraguayans | 94.8 /100 | #85 | Exceptional 5.2% |
| Immigrants | Indonesia | 94.8 /100 | #86 | Exceptional 5.2% |
| Laotians | 94.7 /100 | #87 | Exceptional 5.2% |
| Immigrants | Scotland | 94.5 /100 | #88 | Exceptional 5.2% |