Iroquois vs Iranian Hearing Disability
COMPARE
Iroquois
Iranian
Hearing Disability
Hearing Disability Comparison
Iroquois
Iranians
3.7%
HEARING DISABILITY
0.0/ 100
METRIC RATING
294th/ 347
METRIC RANK
2.8%
HEARING DISABILITY
96.4/ 100
METRIC RATING
92nd/ 347
METRIC RANK
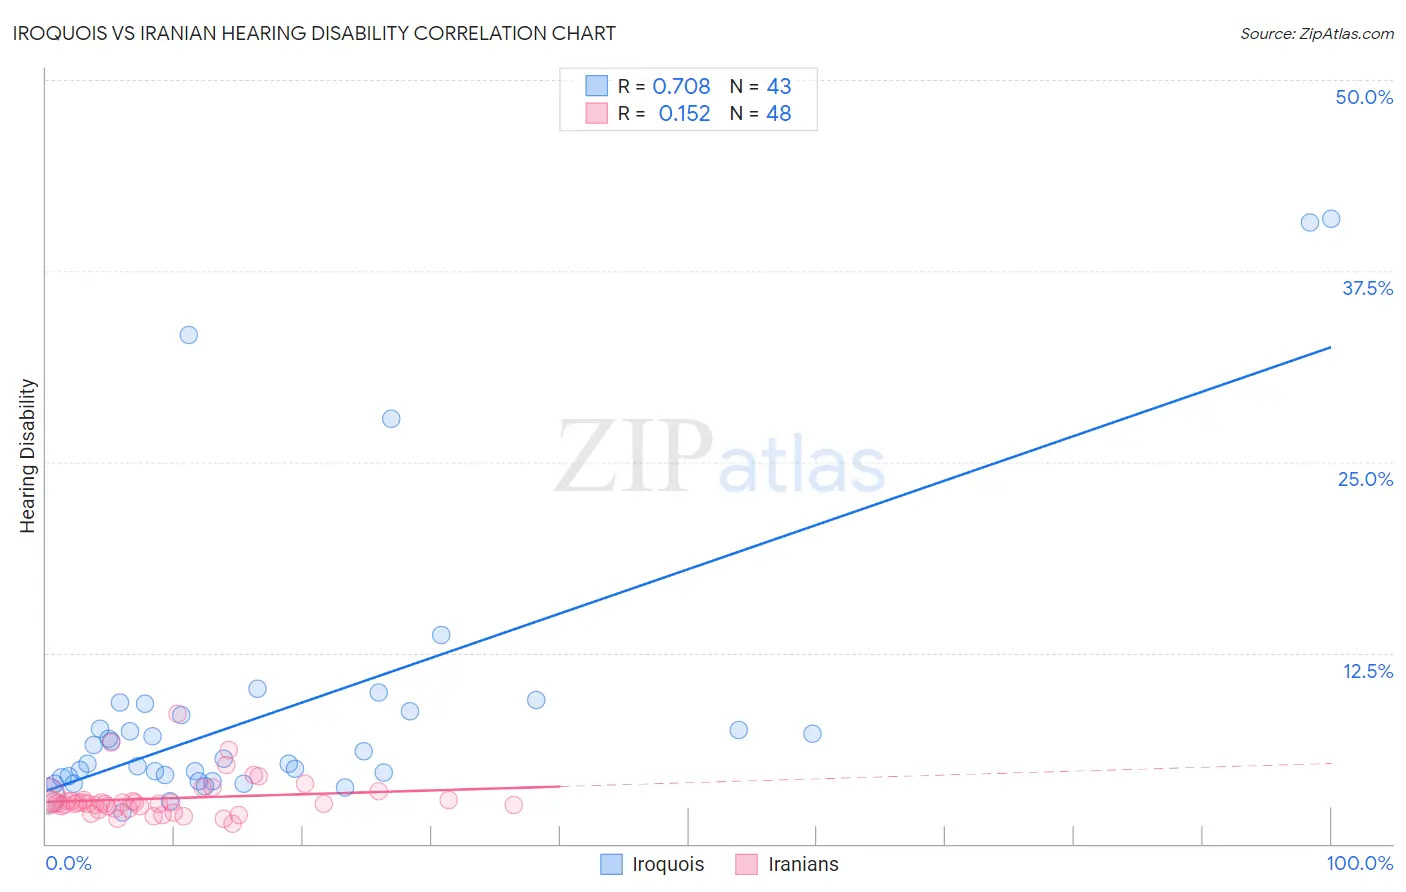
Iroquois vs Iranian Hearing Disability Correlation Chart
The statistical analysis conducted on geographies consisting of 207,234,174 people shows a strong positive correlation between the proportion of Iroquois and percentage of population with hearing disability in the United States with a correlation coefficient (R) of 0.708 and weighted average of 3.7%. Similarly, the statistical analysis conducted on geographies consisting of 316,808,830 people shows a poor positive correlation between the proportion of Iranians and percentage of population with hearing disability in the United States with a correlation coefficient (R) of 0.152 and weighted average of 2.8%, a difference of 33.9%.
Hearing Disability Correlation Summary
| Measurement | Iroquois | Iranian |
| Minimum | 2.0% | 1.3% |
| Maximum | 40.9% | 8.5% |
| Range | 38.9% | 7.2% |
| Mean | 8.8% | 3.0% |
| Median | 5.6% | 2.7% |
| Interquartile 25% (IQ1) | 4.3% | 2.4% |
| Interquartile 75% (IQ3) | 8.7% | 2.8% |
| Interquartile Range (IQR) | 4.4% | 0.46% |
| Standard Deviation (Sample) | 9.2% | 1.3% |
| Standard Deviation (Population) | 9.1% | 1.3% |
Similar Demographics by Hearing Disability
Demographics Similar to Iroquois by Hearing Disability
In terms of hearing disability, the demographic groups most similar to Iroquois are Norwegian (3.7%, a difference of 0.24%), Welsh (3.7%, a difference of 0.27%), Native Hawaiian (3.7%, a difference of 0.30%), Finnish (3.7%, a difference of 0.36%), and White/Caucasian (3.7%, a difference of 0.37%).
| Demographics | Rating | Rank | Hearing Disability |
| Spanish | 0.0 /100 | #287 | Tragic 3.7% |
| Irish | 0.0 /100 | #288 | Tragic 3.7% |
| Chinese | 0.0 /100 | #289 | Tragic 3.7% |
| Whites/Caucasians | 0.0 /100 | #290 | Tragic 3.7% |
| Finns | 0.0 /100 | #291 | Tragic 3.7% |
| Native Hawaiians | 0.0 /100 | #292 | Tragic 3.7% |
| Norwegians | 0.0 /100 | #293 | Tragic 3.7% |
| Iroquois | 0.0 /100 | #294 | Tragic 3.7% |
| Welsh | 0.0 /100 | #295 | Tragic 3.7% |
| Pima | 0.0 /100 | #296 | Tragic 3.7% |
| Immigrants | Azores | 0.0 /100 | #297 | Tragic 3.7% |
| Celtics | 0.0 /100 | #298 | Tragic 3.7% |
| Germans | 0.0 /100 | #299 | Tragic 3.7% |
| Scottish | 0.0 /100 | #300 | Tragic 3.7% |
| Pennsylvania Germans | 0.0 /100 | #301 | Tragic 3.7% |
Demographics Similar to Iranians by Hearing Disability
In terms of hearing disability, the demographic groups most similar to Iranians are Immigrants from Middle Africa (2.8%, a difference of 0.030%), Immigrants from Morocco (2.8%, a difference of 0.11%), Immigrants from Kuwait (2.8%, a difference of 0.12%), Belizean (2.8%, a difference of 0.14%), and Immigrants from Turkey (2.8%, a difference of 0.17%).
| Demographics | Rating | Rank | Hearing Disability |
| Immigrants | Northern Africa | 96.9 /100 | #85 | Exceptional 2.8% |
| Immigrants | Iran | 96.8 /100 | #86 | Exceptional 2.8% |
| Somalis | 96.7 /100 | #87 | Exceptional 2.8% |
| Immigrants | Turkey | 96.7 /100 | #88 | Exceptional 2.8% |
| Belizeans | 96.6 /100 | #89 | Exceptional 2.8% |
| Immigrants | Morocco | 96.6 /100 | #90 | Exceptional 2.8% |
| Immigrants | Middle Africa | 96.5 /100 | #91 | Exceptional 2.8% |
| Iranians | 96.4 /100 | #92 | Exceptional 2.8% |
| Immigrants | Kuwait | 96.3 /100 | #93 | Exceptional 2.8% |
| Uruguayans | 95.9 /100 | #94 | Exceptional 2.8% |
| Israelis | 95.9 /100 | #95 | Exceptional 2.8% |
| Immigrants | Somalia | 95.5 /100 | #96 | Exceptional 2.8% |
| Immigrants | Afghanistan | 95.3 /100 | #97 | Exceptional 2.8% |
| Immigrants | Honduras | 95.1 /100 | #98 | Exceptional 2.8% |
| Immigrants | Guatemala | 95.1 /100 | #99 | Exceptional 2.8% |