Houma vs Indian (Asian) 2 or more Vehicles in Household
COMPARE
Houma
Indian (Asian)
2 or more Vehicles in Household
2 or more Vehicles in Household Comparison
Houma
Indians (Asian)
54.4%
2 OR MORE VEHICLES IN HOUSEHOLD
15.8/ 100
METRIC RATING
200th/ 347
METRIC RANK
53.1%
2 OR MORE VEHICLES IN HOUSEHOLD
1.7/ 100
METRIC RATING
244th/ 347
METRIC RANK
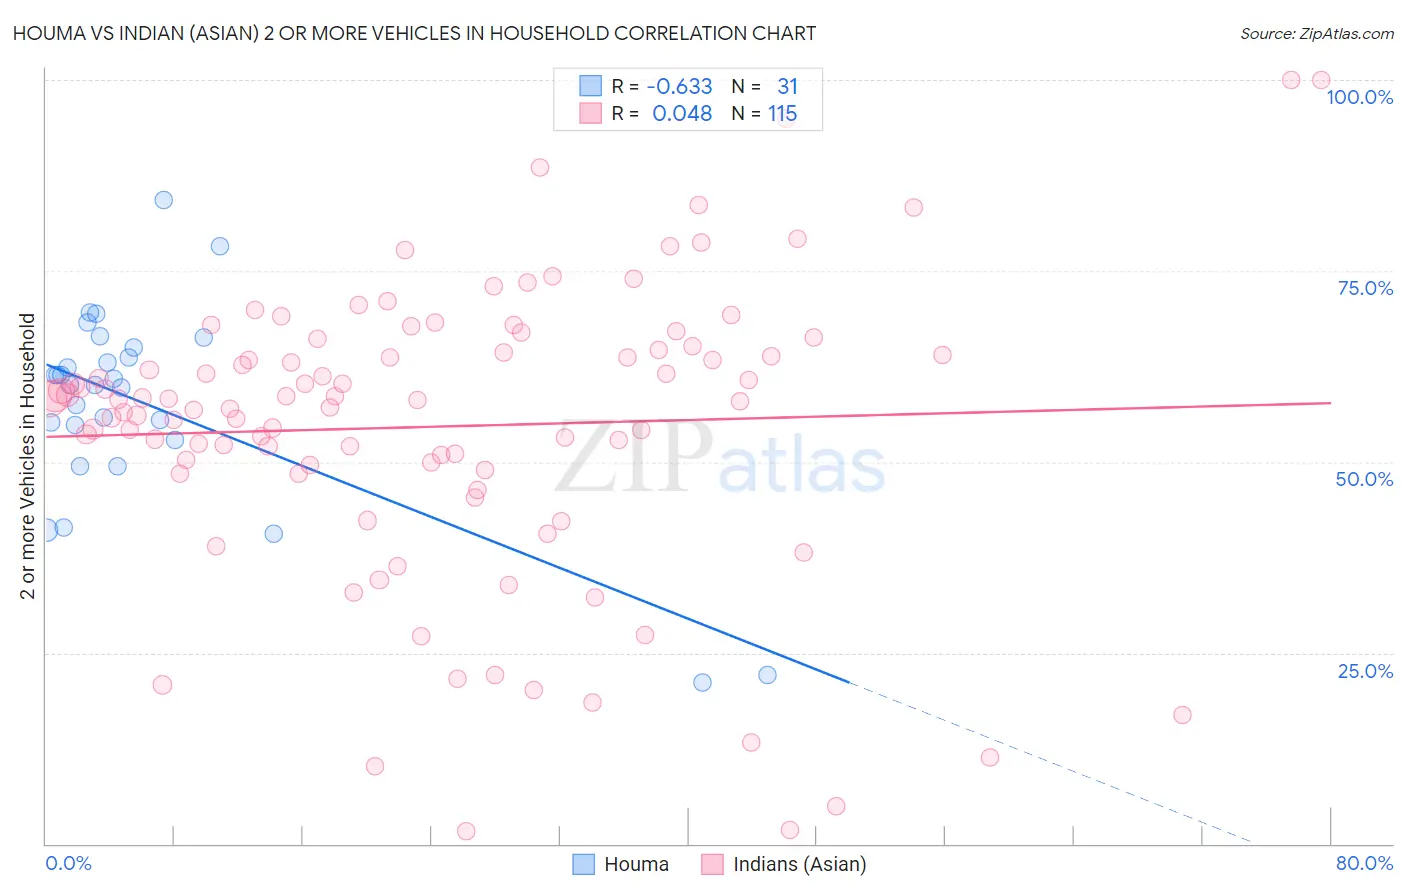
Houma vs Indian (Asian) 2 or more Vehicles in Household Correlation Chart
The statistical analysis conducted on geographies consisting of 36,796,778 people shows a significant negative correlation between the proportion of Houma and percentage of households with 2 or more vehicles available in the United States with a correlation coefficient (R) of -0.633 and weighted average of 54.4%. Similarly, the statistical analysis conducted on geographies consisting of 494,844,203 people shows no correlation between the proportion of Indians (Asian) and percentage of households with 2 or more vehicles available in the United States with a correlation coefficient (R) of 0.048 and weighted average of 53.1%, a difference of 2.5%.
2 or more Vehicles in Household Correlation Summary
| Measurement | Houma | Indian (Asian) |
| Minimum | 21.1% | 1.7% |
| Maximum | 84.3% | 100.0% |
| Range | 63.2% | 98.3% |
| Mean | 57.4% | 54.6% |
| Median | 60.1% | 58.2% |
| Interquartile 25% (IQ1) | 52.8% | 49.0% |
| Interquartile 75% (IQ3) | 65.0% | 64.6% |
| Interquartile Range (IQR) | 12.2% | 15.6% |
| Standard Deviation (Sample) | 13.5% | 19.2% |
| Standard Deviation (Population) | 13.3% | 19.2% |
Similar Demographics by 2 or more Vehicles in Household
Demographics Similar to Houma by 2 or more Vehicles in Household
In terms of 2 or more vehicles in household, the demographic groups most similar to Houma are Immigrants from Norway (54.4%, a difference of 0.0%), Carpatho Rusyn (54.4%, a difference of 0.030%), Immigrants from Italy (54.4%, a difference of 0.030%), Immigrants from North Macedonia (54.4%, a difference of 0.070%), and Argentinean (54.5%, a difference of 0.12%).
| Demographics | Rating | Rank | 2 or more Vehicles in Household |
| Immigrants | Japan | 23.4 /100 | #193 | Fair 54.7% |
| Central Americans | 23.0 /100 | #194 | Fair 54.7% |
| Iroquois | 22.6 /100 | #195 | Fair 54.7% |
| Immigrants | Poland | 19.3 /100 | #196 | Poor 54.6% |
| Argentineans | 17.5 /100 | #197 | Poor 54.5% |
| Carpatho Rusyns | 16.2 /100 | #198 | Poor 54.4% |
| Immigrants | Norway | 15.9 /100 | #199 | Poor 54.4% |
| Houma | 15.8 /100 | #200 | Poor 54.4% |
| Immigrants | Italy | 15.5 /100 | #201 | Poor 54.4% |
| Immigrants | North Macedonia | 14.9 /100 | #202 | Poor 54.4% |
| Immigrants | Peru | 14.3 /100 | #203 | Poor 54.4% |
| Immigrants | Belgium | 13.7 /100 | #204 | Poor 54.3% |
| Cheyenne | 13.6 /100 | #205 | Poor 54.3% |
| Immigrants | Latin America | 13.1 /100 | #206 | Poor 54.3% |
| Turks | 13.0 /100 | #207 | Poor 54.3% |
Demographics Similar to Indians (Asian) by 2 or more Vehicles in Household
In terms of 2 or more vehicles in household, the demographic groups most similar to Indians (Asian) are Ethiopian (53.1%, a difference of 0.040%), Immigrants from Ethiopia (53.0%, a difference of 0.12%), Immigrants from Eastern Asia (53.2%, a difference of 0.23%), Immigrants from Sierra Leone (53.2%, a difference of 0.24%), and Immigrants from Europe (53.2%, a difference of 0.26%).
| Demographics | Rating | Rank | 2 or more Vehicles in Household |
| Macedonians | 2.4 /100 | #237 | Tragic 53.3% |
| Immigrants | Armenia | 2.3 /100 | #238 | Tragic 53.3% |
| Cambodians | 2.3 /100 | #239 | Tragic 53.3% |
| Immigrants | Europe | 2.1 /100 | #240 | Tragic 53.2% |
| Immigrants | Sierra Leone | 2.1 /100 | #241 | Tragic 53.2% |
| Immigrants | Eastern Asia | 2.1 /100 | #242 | Tragic 53.2% |
| Ethiopians | 1.7 /100 | #243 | Tragic 53.1% |
| Indians (Asian) | 1.7 /100 | #244 | Tragic 53.1% |
| Immigrants | Ethiopia | 1.5 /100 | #245 | Tragic 53.0% |
| Immigrants | Nigeria | 1.2 /100 | #246 | Tragic 52.9% |
| Sierra Leoneans | 1.2 /100 | #247 | Tragic 52.9% |
| Colombians | 1.1 /100 | #248 | Tragic 52.9% |
| Immigrants | Brazil | 1.0 /100 | #249 | Tragic 52.8% |
| Mongolians | 1.0 /100 | #250 | Tragic 52.8% |
| Immigrants | Sudan | 1.0 /100 | #251 | Tragic 52.8% |