Iranian vs Senegalese 6th Grade
COMPARE
Iranian
Senegalese
6th Grade
6th Grade Comparison
Iranians
Senegalese
97.6%
6TH GRADE
99.6/ 100
METRIC RATING
69th/ 347
METRIC RANK
96.6%
6TH GRADE
1.8/ 100
METRIC RATING
241st/ 347
METRIC RANK
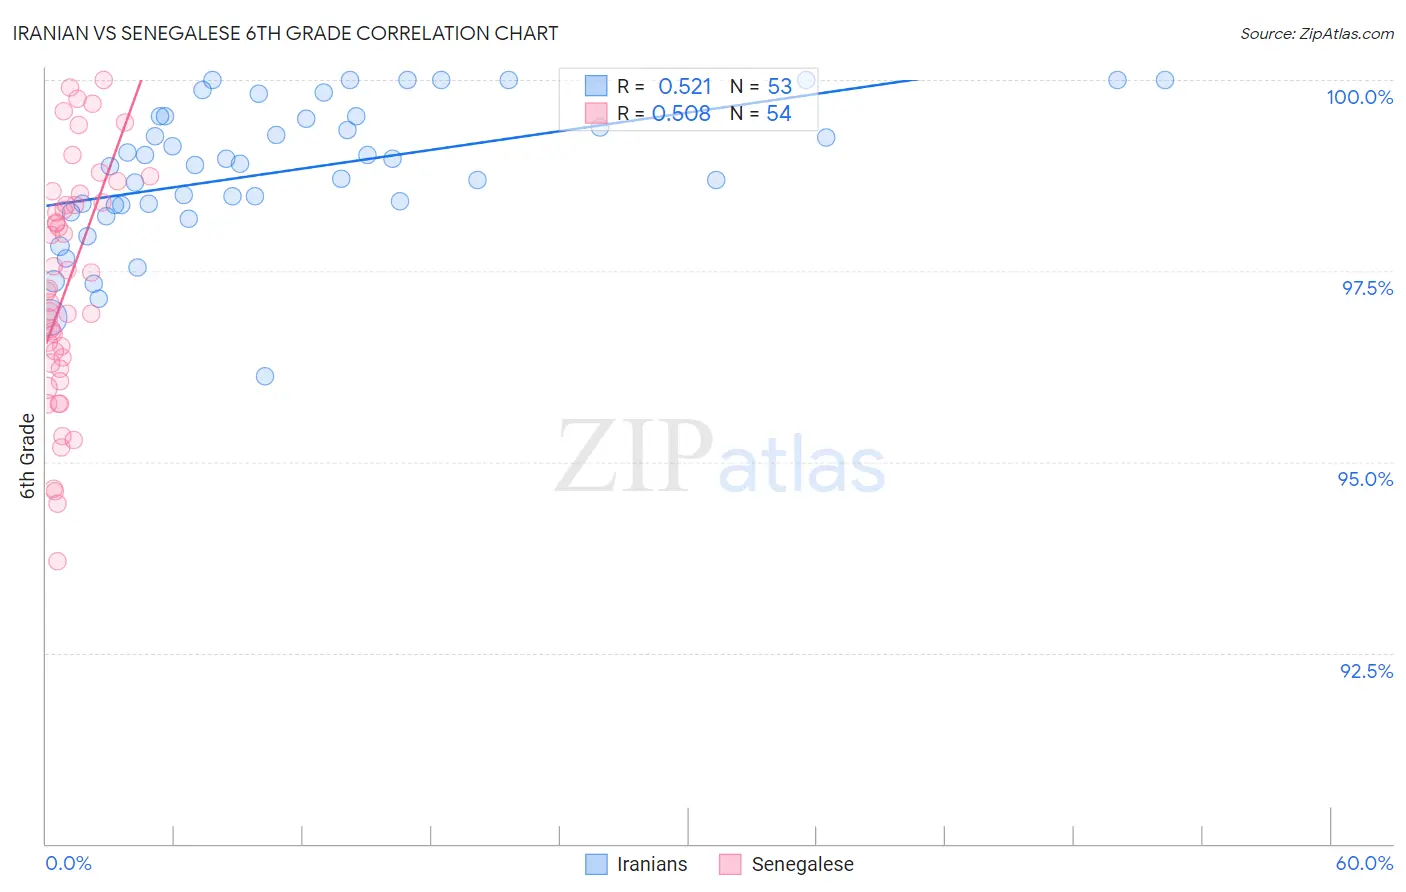
Iranian vs Senegalese 6th Grade Correlation Chart
The statistical analysis conducted on geographies consisting of 310,636,461 people shows a substantial positive correlation between the proportion of Iranians and percentage of population with at least 6th grade education in the United States with a correlation coefficient (R) of 0.521 and weighted average of 97.6%. Similarly, the statistical analysis conducted on geographies consisting of 78,142,569 people shows a substantial positive correlation between the proportion of Senegalese and percentage of population with at least 6th grade education in the United States with a correlation coefficient (R) of 0.508 and weighted average of 96.6%, a difference of 1.1%.
6th Grade Correlation Summary
| Measurement | Iranian | Senegalese |
| Minimum | 96.1% | 93.7% |
| Maximum | 100.0% | 100.0% |
| Range | 3.9% | 6.3% |
| Mean | 98.8% | 97.3% |
| Median | 98.9% | 97.3% |
| Interquartile 25% (IQ1) | 98.4% | 96.3% |
| Interquartile 75% (IQ3) | 99.5% | 98.4% |
| Interquartile Range (IQR) | 1.2% | 2.1% |
| Standard Deviation (Sample) | 0.91% | 1.5% |
| Standard Deviation (Population) | 0.90% | 1.5% |
Similar Demographics by 6th Grade
Demographics Similar to Iranians by 6th Grade
In terms of 6th grade, the demographic groups most similar to Iranians are Cajun (97.6%, a difference of 0.010%), New Zealander (97.7%, a difference of 0.020%), Kiowa (97.7%, a difference of 0.020%), Immigrants from Austria (97.7%, a difference of 0.020%), and Chickasaw (97.6%, a difference of 0.020%).
| Demographics | Rating | Rank | 6th Grade |
| Immigrants | North America | 99.7 /100 | #62 | Exceptional 97.7% |
| Russians | 99.7 /100 | #63 | Exceptional 97.7% |
| Canadians | 99.7 /100 | #64 | Exceptional 97.7% |
| Immigrants | Northern Europe | 99.6 /100 | #65 | Exceptional 97.7% |
| New Zealanders | 99.6 /100 | #66 | Exceptional 97.7% |
| Kiowa | 99.6 /100 | #67 | Exceptional 97.7% |
| Immigrants | Austria | 99.6 /100 | #68 | Exceptional 97.7% |
| Iranians | 99.6 /100 | #69 | Exceptional 97.6% |
| Cajuns | 99.5 /100 | #70 | Exceptional 97.6% |
| Chickasaw | 99.5 /100 | #71 | Exceptional 97.6% |
| Macedonians | 99.4 /100 | #72 | Exceptional 97.6% |
| Cherokee | 99.4 /100 | #73 | Exceptional 97.6% |
| Immigrants | Netherlands | 99.4 /100 | #74 | Exceptional 97.6% |
| Ukrainians | 99.4 /100 | #75 | Exceptional 97.6% |
| Immigrants | England | 99.4 /100 | #76 | Exceptional 97.6% |
Demographics Similar to Senegalese by 6th Grade
In terms of 6th grade, the demographic groups most similar to Senegalese are Nigerian (96.6%, a difference of 0.0%), Indian (Asian) (96.6%, a difference of 0.0%), Korean (96.6%, a difference of 0.0%), Immigrants from Asia (96.6%, a difference of 0.0%), and Immigrants from Eastern Africa (96.6%, a difference of 0.010%).
| Demographics | Rating | Rank | 6th Grade |
| Uruguayans | 2.5 /100 | #234 | Tragic 96.6% |
| Asians | 2.4 /100 | #235 | Tragic 96.6% |
| Immigrants | Indonesia | 2.3 /100 | #236 | Tragic 96.6% |
| Immigrants | Eastern Africa | 2.0 /100 | #237 | Tragic 96.6% |
| Nigerians | 1.9 /100 | #238 | Tragic 96.6% |
| Indians (Asian) | 1.9 /100 | #239 | Tragic 96.6% |
| Koreans | 1.9 /100 | #240 | Tragic 96.6% |
| Senegalese | 1.8 /100 | #241 | Tragic 96.6% |
| Immigrants | Asia | 1.8 /100 | #242 | Tragic 96.6% |
| Immigrants | Liberia | 1.6 /100 | #243 | Tragic 96.6% |
| Ethiopians | 1.5 /100 | #244 | Tragic 96.6% |
| Immigrants | Costa Rica | 1.3 /100 | #245 | Tragic 96.6% |
| Immigrants | Africa | 1.3 /100 | #246 | Tragic 96.6% |
| Bolivians | 1.0 /100 | #247 | Tragic 96.5% |
| Tohono O'odham | 1.0 /100 | #248 | Tragic 96.5% |