Indian (Asian) vs Immigrants from China No Vehicles in Household
COMPARE
Indian (Asian)
Immigrants from China
No Vehicles in Household
No Vehicles in Household Comparison
Indians (Asian)
Immigrants from China
14.1%
NO VEHICLES IN HOUSEHOLD
0.0/ 100
METRIC RATING
290th/ 347
METRIC RANK
15.2%
NO VEHICLES IN HOUSEHOLD
0.0/ 100
METRIC RATING
305th/ 347
METRIC RANK
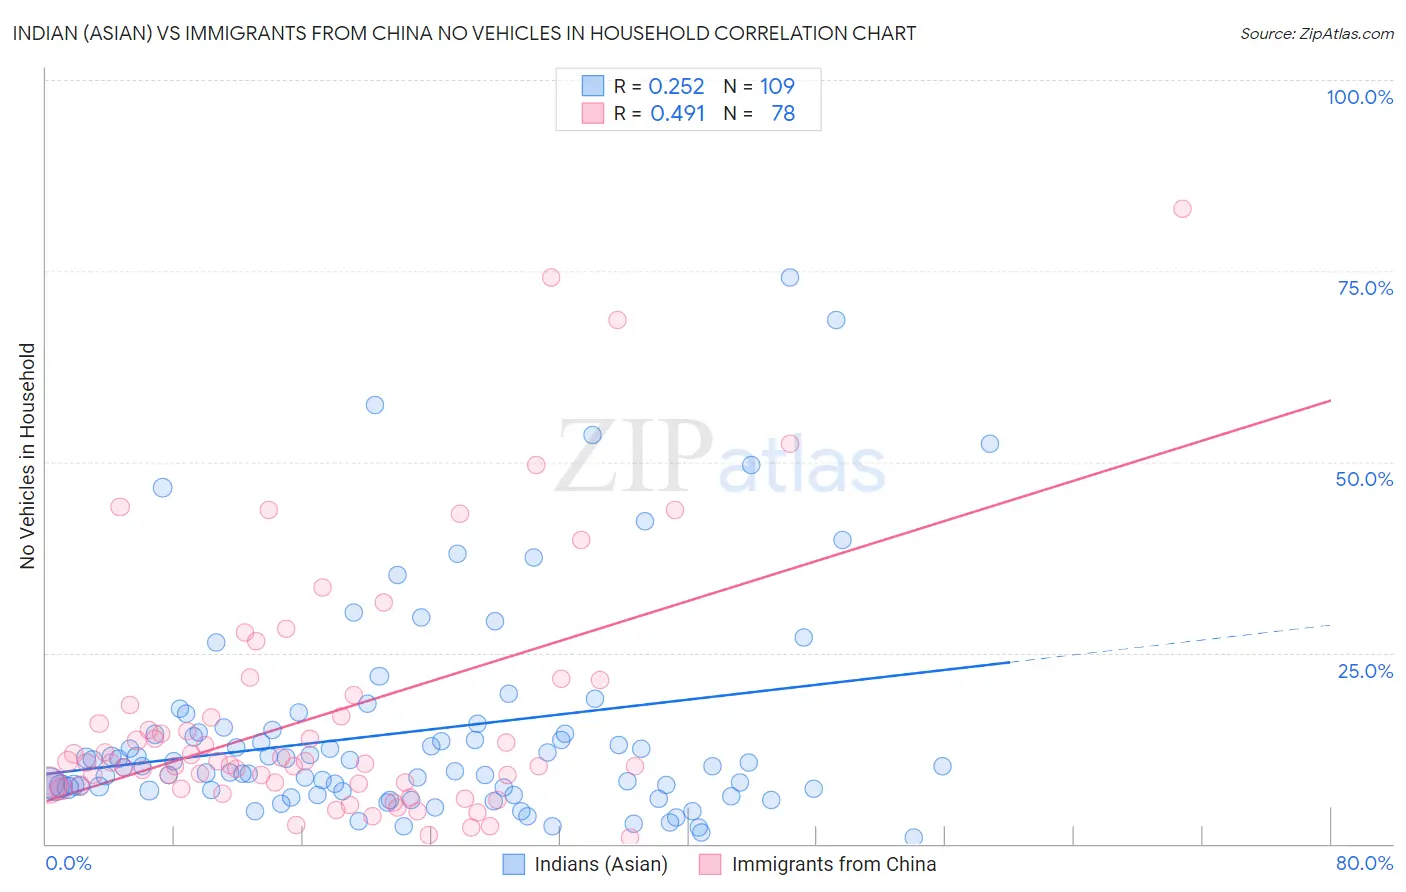
Indian (Asian) vs Immigrants from China No Vehicles in Household Correlation Chart
The statistical analysis conducted on geographies consisting of 492,881,185 people shows a weak positive correlation between the proportion of Indians (Asian) and percentage of households with no vehicle available in the United States with a correlation coefficient (R) of 0.252 and weighted average of 14.1%. Similarly, the statistical analysis conducted on geographies consisting of 455,244,510 people shows a moderate positive correlation between the proportion of Immigrants from China and percentage of households with no vehicle available in the United States with a correlation coefficient (R) of 0.491 and weighted average of 15.2%, a difference of 7.8%.
No Vehicles in Household Correlation Summary
| Measurement | Indian (Asian) | Immigrants from China |
| Minimum | 0.81% | 0.81% |
| Maximum | 74.2% | 83.2% |
| Range | 73.4% | 82.4% |
| Mean | 14.7% | 16.9% |
| Median | 10.1% | 10.7% |
| Interquartile 25% (IQ1) | 7.0% | 7.7% |
| Interquartile 75% (IQ3) | 14.7% | 18.2% |
| Interquartile Range (IQR) | 7.7% | 10.5% |
| Standard Deviation (Sample) | 14.2% | 16.7% |
| Standard Deviation (Population) | 14.1% | 16.6% |
Demographics Similar to Indians (Asian) and Immigrants from China by No Vehicles in Household
In terms of no vehicles in household, the demographic groups most similar to Indians (Asian) are Okinawan (14.1%, a difference of 0.0%), Pima (14.1%, a difference of 0.49%), Immigrants from Jamaica (14.2%, a difference of 1.1%), Immigrants from Australia (13.8%, a difference of 1.7%), and Belizean (14.3%, a difference of 1.9%). Similarly, the demographic groups most similar to Immigrants from China are Immigrants from Russia (15.1%, a difference of 0.38%), Immigrants from Western Africa (15.0%, a difference of 1.0%), Immigrants from Belize (15.4%, a difference of 1.3%), Immigrants from Haiti (15.4%, a difference of 1.5%), and Haitian (14.9%, a difference of 1.6%).
| Demographics | Rating | Rank | No Vehicles in Household |
| Immigrants | Ireland | 0.0 /100 | #287 | Tragic 13.7% |
| Hopi | 0.0 /100 | #288 | Tragic 13.7% |
| Immigrants | Australia | 0.0 /100 | #289 | Tragic 13.8% |
| Indians (Asian) | 0.0 /100 | #290 | Tragic 14.1% |
| Okinawans | 0.0 /100 | #291 | Tragic 14.1% |
| Pima | 0.0 /100 | #292 | Tragic 14.1% |
| Immigrants | Jamaica | 0.0 /100 | #293 | Tragic 14.2% |
| Belizeans | 0.0 /100 | #294 | Tragic 14.3% |
| Paraguayans | 0.0 /100 | #295 | Tragic 14.4% |
| Immigrants | Spain | 0.0 /100 | #296 | Tragic 14.5% |
| Immigrants | Panama | 0.0 /100 | #297 | Tragic 14.6% |
| Moroccans | 0.0 /100 | #298 | Tragic 14.7% |
| Immigrants | Greece | 0.0 /100 | #299 | Tragic 14.7% |
| Yuman | 0.0 /100 | #300 | Tragic 14.9% |
| Immigrants | Ukraine | 0.0 /100 | #301 | Tragic 14.9% |
| Haitians | 0.0 /100 | #302 | Tragic 14.9% |
| Immigrants | Western Africa | 0.0 /100 | #303 | Tragic 15.0% |
| Immigrants | Russia | 0.0 /100 | #304 | Tragic 15.1% |
| Immigrants | China | 0.0 /100 | #305 | Tragic 15.2% |
| Immigrants | Belize | 0.0 /100 | #306 | Tragic 15.4% |
| Immigrants | Haiti | 0.0 /100 | #307 | Tragic 15.4% |