Immigrants from Jordan vs Chippewa 2 or more Vehicles in Household
COMPARE
Immigrants from Jordan
Chippewa
2 or more Vehicles in Household
2 or more Vehicles in Household Comparison
Immigrants from Jordan
Chippewa
57.2%
2 OR MORE VEHICLES IN HOUSEHOLD
96.6/ 100
METRIC RATING
116th/ 347
METRIC RANK
57.2%
2 OR MORE VEHICLES IN HOUSEHOLD
96.6/ 100
METRIC RATING
115th/ 347
METRIC RANK
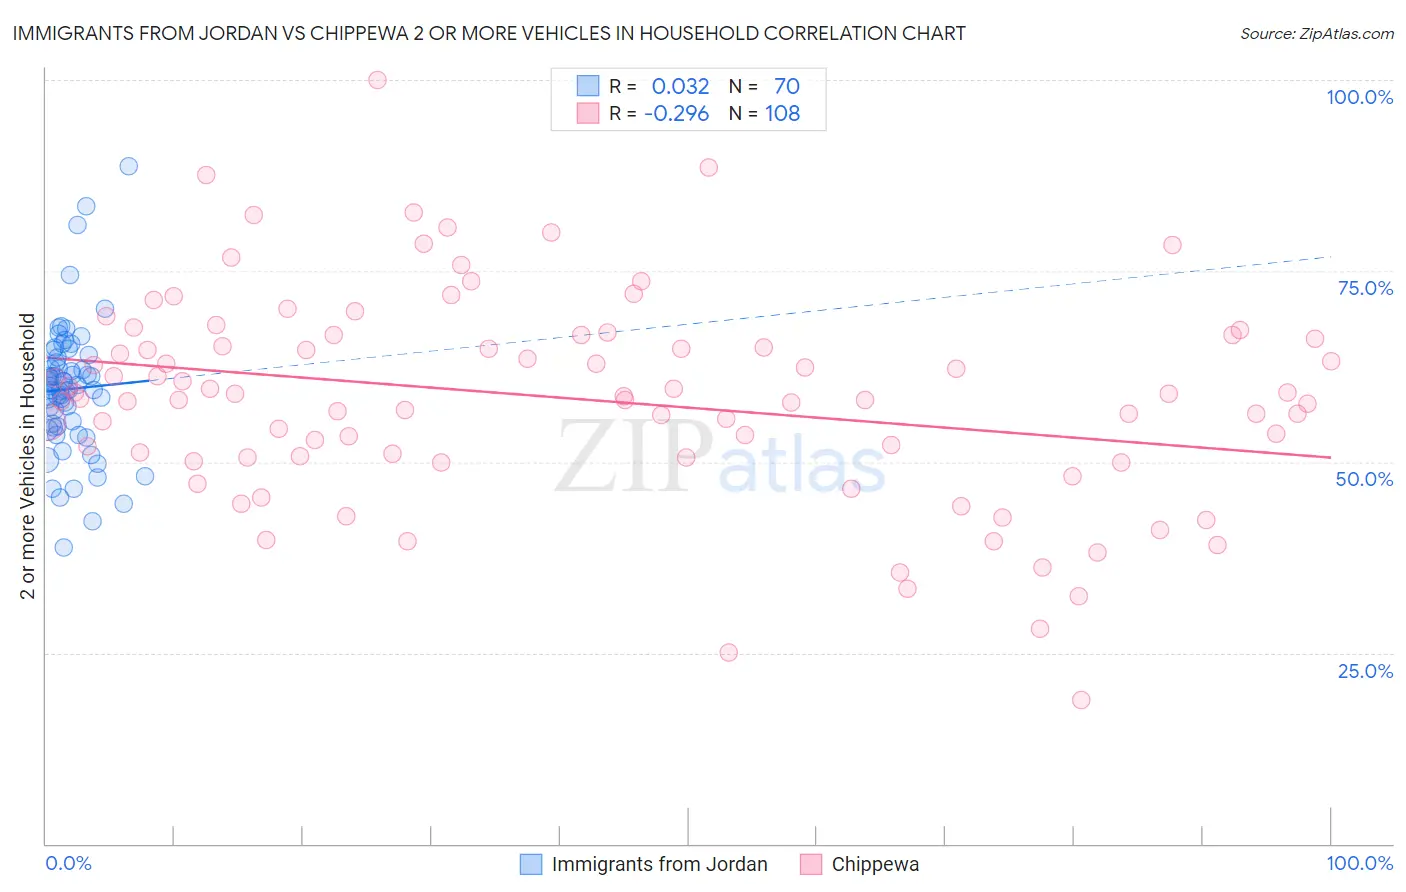
Immigrants from Jordan vs Chippewa 2 or more Vehicles in Household Correlation Chart
The statistical analysis conducted on geographies consisting of 181,252,999 people shows no correlation between the proportion of Immigrants from Jordan and percentage of households with 2 or more vehicles available in the United States with a correlation coefficient (R) of 0.032 and weighted average of 57.2%. Similarly, the statistical analysis conducted on geographies consisting of 215,015,237 people shows a weak negative correlation between the proportion of Chippewa and percentage of households with 2 or more vehicles available in the United States with a correlation coefficient (R) of -0.296 and weighted average of 57.2%, a difference of 0.010%.
2 or more Vehicles in Household Correlation Summary
| Measurement | Immigrants from Jordan | Chippewa |
| Minimum | 38.9% | 18.9% |
| Maximum | 88.8% | 100.0% |
| Range | 49.9% | 81.1% |
| Mean | 59.5% | 58.3% |
| Median | 59.7% | 58.5% |
| Interquartile 25% (IQ1) | 54.7% | 50.7% |
| Interquartile 75% (IQ3) | 63.6% | 66.4% |
| Interquartile Range (IQR) | 8.9% | 15.7% |
| Standard Deviation (Sample) | 8.6% | 13.7% |
| Standard Deviation (Population) | 8.6% | 13.7% |
Demographics Similar to Immigrants from Jordan and Chippewa by 2 or more Vehicles in Household
In terms of 2 or more vehicles in household, the demographic groups most similar to Immigrants from Jordan are Immigrants from Lebanon (57.2%, a difference of 0.070%), Zimbabwean (57.2%, a difference of 0.10%), Iraqi (57.1%, a difference of 0.19%), Asian (57.0%, a difference of 0.36%), and Native/Alaskan (57.0%, a difference of 0.38%). Similarly, the demographic groups most similar to Chippewa are Immigrants from Lebanon (57.2%, a difference of 0.050%), Zimbabwean (57.2%, a difference of 0.090%), Iraqi (57.1%, a difference of 0.20%), Asian (57.0%, a difference of 0.37%), and Native/Alaskan (57.0%, a difference of 0.40%).
| Demographics | Rating | Rank | 2 or more Vehicles in Household |
| Immigrants | Korea | 98.2 /100 | #105 | Exceptional 57.6% |
| Immigrants | Oceania | 98.2 /100 | #106 | Exceptional 57.5% |
| Immigrants | Netherlands | 98.2 /100 | #107 | Exceptional 57.5% |
| Immigrants | Canada | 98.1 /100 | #108 | Exceptional 57.5% |
| Immigrants | North America | 98.1 /100 | #109 | Exceptional 57.5% |
| Japanese | 98.0 /100 | #110 | Exceptional 57.5% |
| Greeks | 98.0 /100 | #111 | Exceptional 57.5% |
| Pueblo | 98.0 /100 | #112 | Exceptional 57.5% |
| Zimbabweans | 96.9 /100 | #113 | Exceptional 57.2% |
| Immigrants | Lebanon | 96.8 /100 | #114 | Exceptional 57.2% |
| Chippewa | 96.6 /100 | #115 | Exceptional 57.2% |
| Immigrants | Jordan | 96.6 /100 | #116 | Exceptional 57.2% |
| Iraqis | 95.8 /100 | #117 | Exceptional 57.1% |
| Asians | 95.1 /100 | #118 | Exceptional 57.0% |
| Natives/Alaskans | 95.0 /100 | #119 | Exceptional 57.0% |
| Costa Ricans | 94.7 /100 | #120 | Exceptional 56.9% |
| Sioux | 93.8 /100 | #121 | Exceptional 56.8% |
| Immigrants | South Africa | 92.5 /100 | #122 | Exceptional 56.7% |
| Australians | 91.8 /100 | #123 | Exceptional 56.7% |
| New Zealanders | 91.8 /100 | #124 | Exceptional 56.7% |
| Tsimshian | 91.6 /100 | #125 | Exceptional 56.7% |