Immigrants vs Liberian 2 or more Vehicles in Household
COMPARE
Immigrants
Liberian
2 or more Vehicles in Household
2 or more Vehicles in Household Comparison
Immigrants
Liberians
54.7%
2 OR MORE VEHICLES IN HOUSEHOLD
25.0/ 100
METRIC RATING
191st/ 347
METRIC RANK
51.7%
2 OR MORE VEHICLES IN HOUSEHOLD
0.1/ 100
METRIC RATING
279th/ 347
METRIC RANK
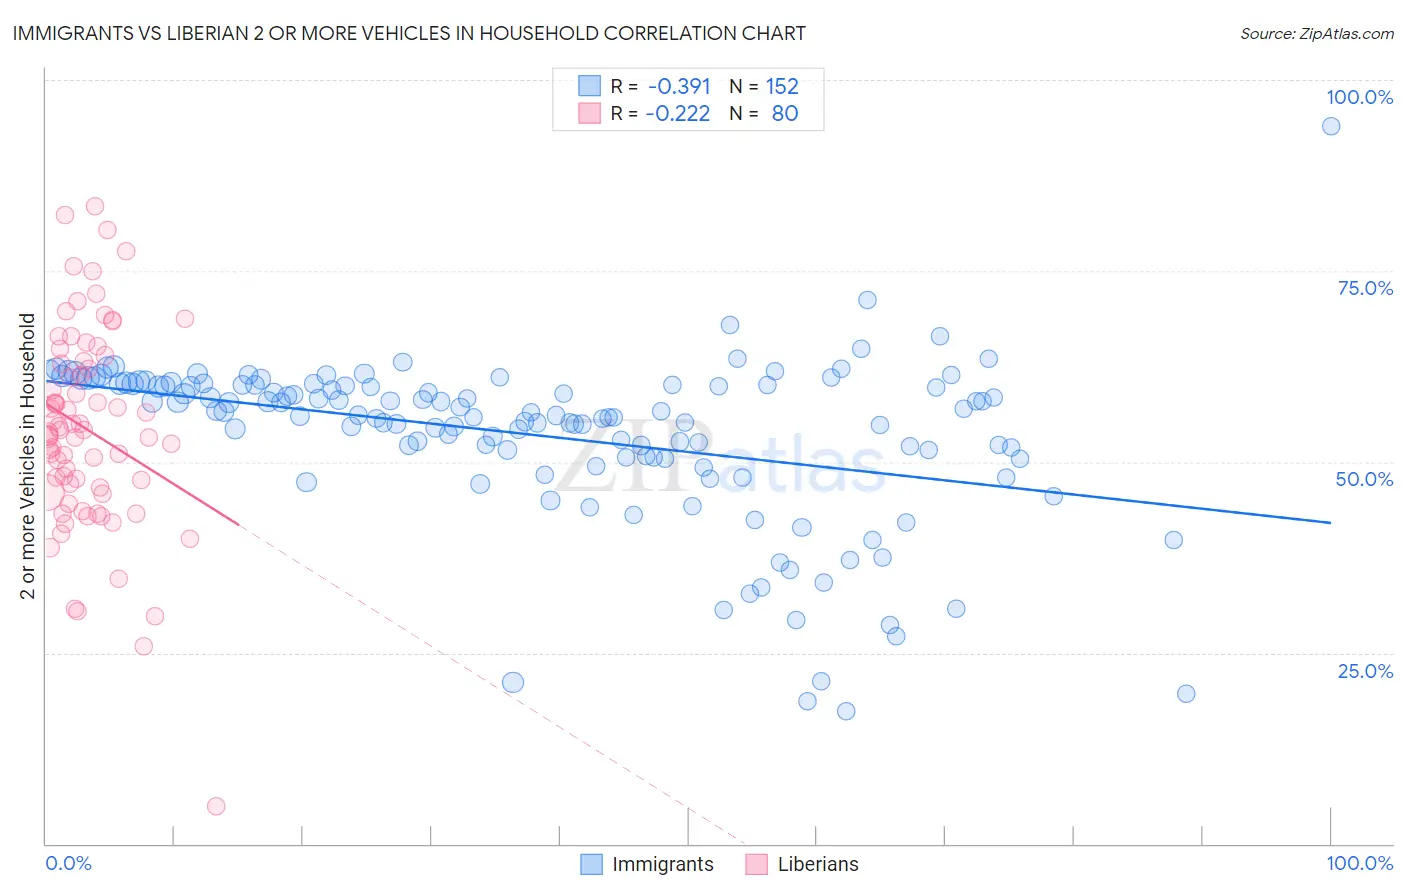
Immigrants vs Liberian 2 or more Vehicles in Household Correlation Chart
The statistical analysis conducted on geographies consisting of 577,129,923 people shows a mild negative correlation between the proportion of Immigrants and percentage of households with 2 or more vehicles available in the United States with a correlation coefficient (R) of -0.391 and weighted average of 54.7%. Similarly, the statistical analysis conducted on geographies consisting of 118,047,251 people shows a weak negative correlation between the proportion of Liberians and percentage of households with 2 or more vehicles available in the United States with a correlation coefficient (R) of -0.222 and weighted average of 51.7%, a difference of 5.8%.
2 or more Vehicles in Household Correlation Summary
| Measurement | Immigrants | Liberian |
| Minimum | 17.3% | 4.9% |
| Maximum | 94.0% | 83.5% |
| Range | 76.6% | 78.6% |
| Mean | 53.4% | 54.2% |
| Median | 56.3% | 54.0% |
| Interquartile 25% (IQ1) | 50.6% | 46.3% |
| Interquartile 75% (IQ3) | 60.1% | 63.0% |
| Interquartile Range (IQR) | 9.5% | 16.7% |
| Standard Deviation (Sample) | 10.9% | 13.4% |
| Standard Deviation (Population) | 10.9% | 13.3% |
Similar Demographics by 2 or more Vehicles in Household
Demographics Similar to Immigrants by 2 or more Vehicles in Household
In terms of 2 or more vehicles in household, the demographic groups most similar to Immigrants are Immigrants from Romania (54.7%, a difference of 0.060%), Russian (54.8%, a difference of 0.070%), Immigrants from Japan (54.7%, a difference of 0.090%), Central American (54.7%, a difference of 0.11%), and Eastern European (54.8%, a difference of 0.13%).
| Demographics | Rating | Rank | 2 or more Vehicles in Household |
| Apache | 36.7 /100 | #184 | Fair 55.1% |
| Arabs | 35.9 /100 | #185 | Fair 55.0% |
| Peruvians | 33.7 /100 | #186 | Fair 55.0% |
| Immigrants | Uganda | 33.4 /100 | #187 | Fair 55.0% |
| Marshallese | 30.5 /100 | #188 | Fair 54.9% |
| Eastern Europeans | 27.5 /100 | #189 | Fair 54.8% |
| Russians | 26.3 /100 | #190 | Fair 54.8% |
| Immigrants | Immigrants | 25.0 /100 | #191 | Fair 54.7% |
| Immigrants | Romania | 23.8 /100 | #192 | Fair 54.7% |
| Immigrants | Japan | 23.4 /100 | #193 | Fair 54.7% |
| Central Americans | 23.0 /100 | #194 | Fair 54.7% |
| Iroquois | 22.6 /100 | #195 | Fair 54.7% |
| Immigrants | Poland | 19.3 /100 | #196 | Poor 54.6% |
| Argentineans | 17.5 /100 | #197 | Poor 54.5% |
| Carpatho Rusyns | 16.2 /100 | #198 | Poor 54.4% |
Demographics Similar to Liberians by 2 or more Vehicles in Household
In terms of 2 or more vehicles in household, the demographic groups most similar to Liberians are Yuman (51.7%, a difference of 0.010%), Immigrants from Eastern Europe (51.7%, a difference of 0.030%), Immigrants from Africa (51.8%, a difference of 0.070%), Immigrants from Croatia (51.8%, a difference of 0.13%), and Immigrants from Honduras (51.8%, a difference of 0.15%).
| Demographics | Rating | Rank | 2 or more Vehicles in Household |
| Sub-Saharan Africans | 0.2 /100 | #272 | Tragic 51.9% |
| Israelis | 0.2 /100 | #273 | Tragic 51.9% |
| Africans | 0.2 /100 | #274 | Tragic 51.8% |
| Immigrants | Honduras | 0.2 /100 | #275 | Tragic 51.8% |
| Immigrants | Croatia | 0.2 /100 | #276 | Tragic 51.8% |
| Immigrants | Africa | 0.2 /100 | #277 | Tragic 51.8% |
| Yuman | 0.1 /100 | #278 | Tragic 51.7% |
| Liberians | 0.1 /100 | #279 | Tragic 51.7% |
| Immigrants | Eastern Europe | 0.1 /100 | #280 | Tragic 51.7% |
| Immigrants | Kazakhstan | 0.1 /100 | #281 | Tragic 51.6% |
| Bahamians | 0.1 /100 | #282 | Tragic 51.5% |
| Immigrants | China | 0.1 /100 | #283 | Tragic 51.5% |
| Immigrants | Zaire | 0.1 /100 | #284 | Tragic 51.5% |
| Immigrants | Uruguay | 0.1 /100 | #285 | Tragic 51.4% |
| Immigrants | Liberia | 0.1 /100 | #286 | Tragic 51.3% |