Immigrants vs Immigrants from Kenya 2 or more Vehicles in Household
COMPARE
Immigrants
Immigrants from Kenya
2 or more Vehicles in Household
2 or more Vehicles in Household Comparison
Immigrants
Immigrants from Kenya
54.7%
2 OR MORE VEHICLES IN HOUSEHOLD
25.0/ 100
METRIC RATING
191st/ 347
METRIC RANK
55.1%
2 OR MORE VEHICLES IN HOUSEHOLD
40.4/ 100
METRIC RATING
180th/ 347
METRIC RANK
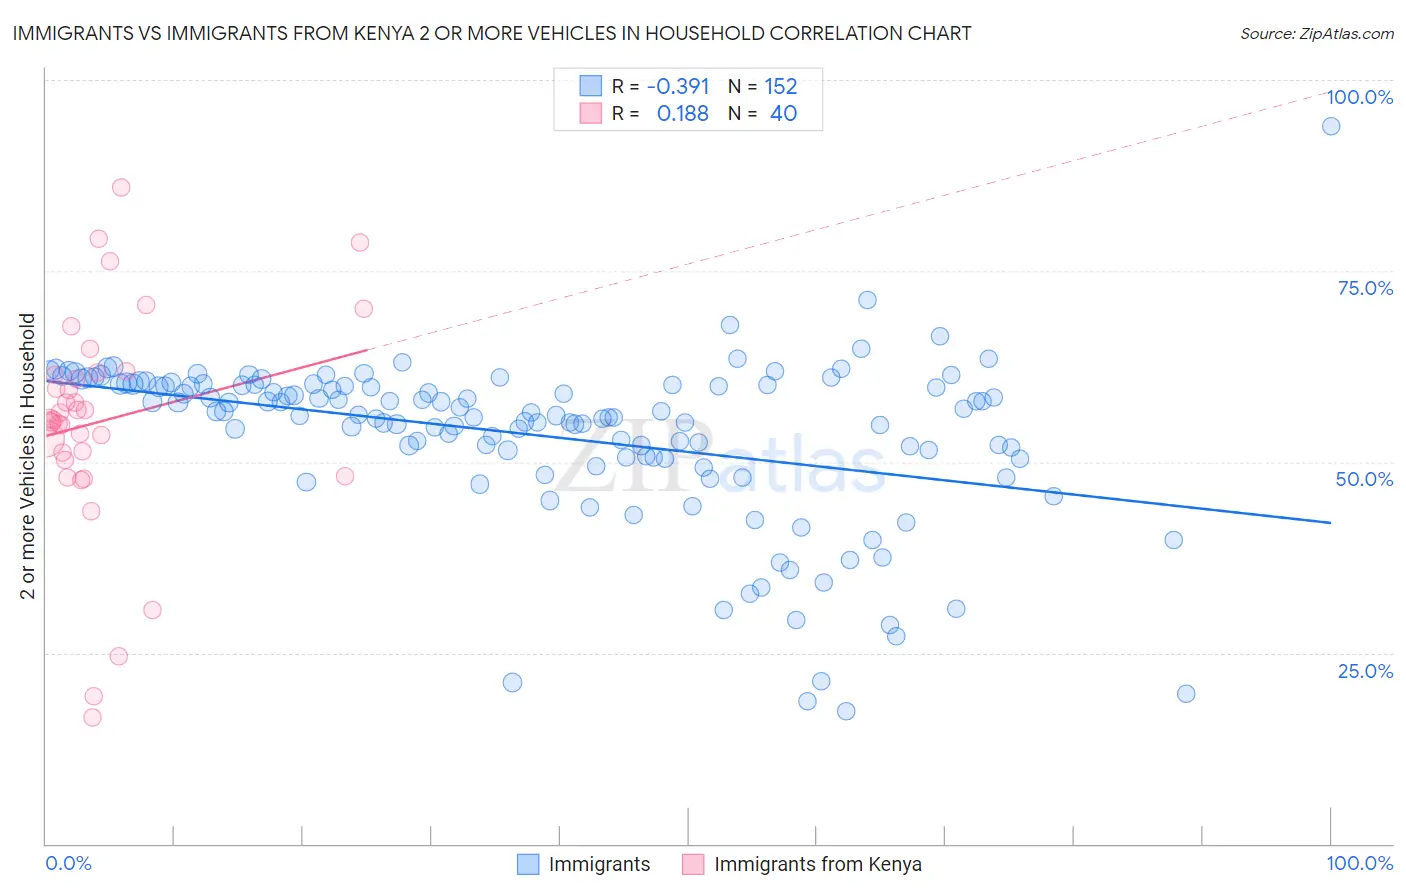
Immigrants vs Immigrants from Kenya 2 or more Vehicles in Household Correlation Chart
The statistical analysis conducted on geographies consisting of 577,129,923 people shows a mild negative correlation between the proportion of Immigrants and percentage of households with 2 or more vehicles available in the United States with a correlation coefficient (R) of -0.391 and weighted average of 54.7%. Similarly, the statistical analysis conducted on geographies consisting of 218,001,481 people shows a poor positive correlation between the proportion of Immigrants from Kenya and percentage of households with 2 or more vehicles available in the United States with a correlation coefficient (R) of 0.188 and weighted average of 55.1%, a difference of 0.71%.
2 or more Vehicles in Household Correlation Summary
| Measurement | Immigrants | Immigrants from Kenya |
| Minimum | 17.3% | 16.4% |
| Maximum | 94.0% | 85.9% |
| Range | 76.6% | 69.4% |
| Mean | 53.4% | 55.3% |
| Median | 56.3% | 55.6% |
| Interquartile 25% (IQ1) | 50.6% | 50.7% |
| Interquartile 75% (IQ3) | 60.1% | 61.6% |
| Interquartile Range (IQR) | 9.5% | 10.9% |
| Standard Deviation (Sample) | 10.9% | 14.5% |
| Standard Deviation (Population) | 10.9% | 14.3% |
Demographics Similar to Immigrants and Immigrants from Kenya by 2 or more Vehicles in Household
In terms of 2 or more vehicles in household, the demographic groups most similar to Immigrants are Immigrants from Romania (54.7%, a difference of 0.060%), Russian (54.8%, a difference of 0.070%), Immigrants from Japan (54.7%, a difference of 0.090%), Central American (54.7%, a difference of 0.11%), and Eastern European (54.8%, a difference of 0.13%). Similarly, the demographic groups most similar to Immigrants from Kenya are Immigrants from Micronesia (55.1%, a difference of 0.090%), Cree (55.1%, a difference of 0.090%), Alaskan Athabascan (55.2%, a difference of 0.11%), Immigrants from Cameroon (55.1%, a difference of 0.13%), and Apache (55.1%, a difference of 0.15%).
| Demographics | Rating | Rank | 2 or more Vehicles in Household |
| Immigrants | Denmark | 49.4 /100 | #175 | Average 55.3% |
| Immigrants | Cuba | 47.0 /100 | #176 | Average 55.3% |
| Menominee | 46.2 /100 | #177 | Average 55.3% |
| Immigrants | Sweden | 45.3 /100 | #178 | Average 55.2% |
| Alaskan Athabascans | 42.9 /100 | #179 | Average 55.2% |
| Immigrants | Kenya | 40.4 /100 | #180 | Average 55.1% |
| Immigrants | Micronesia | 38.2 /100 | #181 | Fair 55.1% |
| Cree | 38.2 /100 | #182 | Fair 55.1% |
| Immigrants | Cameroon | 37.3 /100 | #183 | Fair 55.1% |
| Apache | 36.7 /100 | #184 | Fair 55.1% |
| Arabs | 35.9 /100 | #185 | Fair 55.0% |
| Peruvians | 33.7 /100 | #186 | Fair 55.0% |
| Immigrants | Uganda | 33.4 /100 | #187 | Fair 55.0% |
| Marshallese | 30.5 /100 | #188 | Fair 54.9% |
| Eastern Europeans | 27.5 /100 | #189 | Fair 54.8% |
| Russians | 26.3 /100 | #190 | Fair 54.8% |
| Immigrants | Immigrants | 25.0 /100 | #191 | Fair 54.7% |
| Immigrants | Romania | 23.8 /100 | #192 | Fair 54.7% |
| Immigrants | Japan | 23.4 /100 | #193 | Fair 54.7% |
| Central Americans | 23.0 /100 | #194 | Fair 54.7% |
| Iroquois | 22.6 /100 | #195 | Fair 54.7% |