Immigrants from West Indies vs Danish Single Father Households
COMPARE
Immigrants from West Indies
Danish
Single Father Households
Single Father Households Comparison
Immigrants from West Indies
Danes
2.3%
SINGLE FATHER HOUSEHOLDS
77.9/ 100
METRIC RATING
159th/ 347
METRIC RANK
2.3%
SINGLE FATHER HOUSEHOLDS
48.2/ 100
METRIC RATING
176th/ 347
METRIC RANK
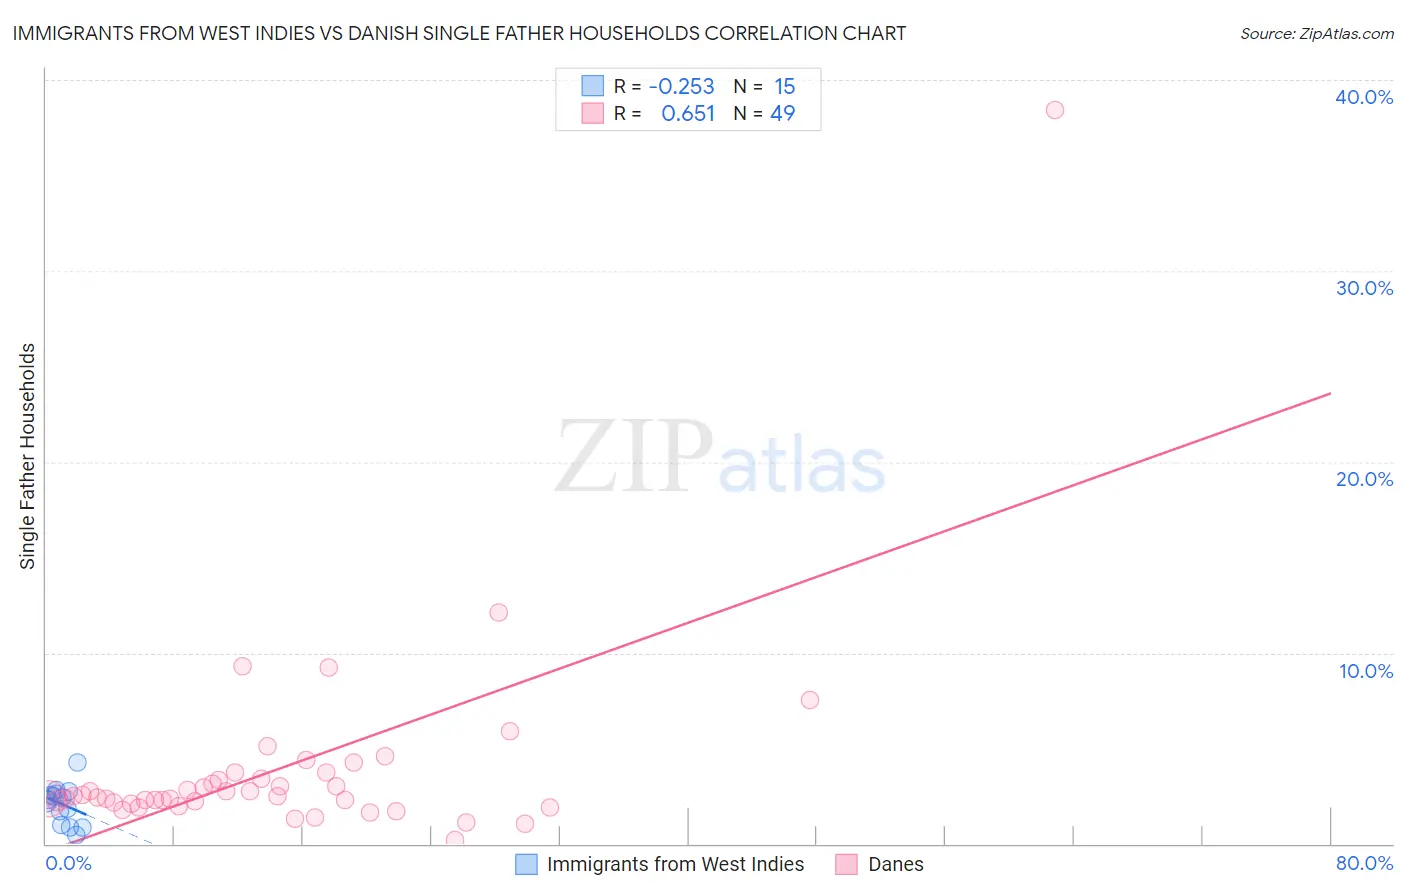
Immigrants from West Indies vs Danish Single Father Households Correlation Chart
The statistical analysis conducted on geographies consisting of 72,343,570 people shows a weak negative correlation between the proportion of Immigrants from West Indies and percentage of single father households in the United States with a correlation coefficient (R) of -0.253 and weighted average of 2.3%. Similarly, the statistical analysis conducted on geographies consisting of 466,880,679 people shows a significant positive correlation between the proportion of Danes and percentage of single father households in the United States with a correlation coefficient (R) of 0.651 and weighted average of 2.3%, a difference of 2.5%.
Single Father Households Correlation Summary
| Measurement | Immigrants from West Indies | Danish |
| Minimum | 0.47% | 0.21% |
| Maximum | 4.3% | 38.5% |
| Range | 3.8% | 38.2% |
| Mean | 2.1% | 3.9% |
| Median | 2.3% | 2.5% |
| Interquartile 25% (IQ1) | 0.99% | 2.1% |
| Interquartile 75% (IQ3) | 2.6% | 3.6% |
| Interquartile Range (IQR) | 1.6% | 1.5% |
| Standard Deviation (Sample) | 0.99% | 5.5% |
| Standard Deviation (Population) | 0.95% | 5.5% |
Demographics Similar to Immigrants from West Indies and Danes by Single Father Households
In terms of single father households, the demographic groups most similar to Immigrants from West Indies are Immigrants from Senegal (2.3%, a difference of 0.17%), Immigrants from Bolivia (2.3%, a difference of 0.18%), Canadian (2.3%, a difference of 0.20%), Swiss (2.3%, a difference of 0.48%), and Scottish (2.3%, a difference of 0.51%). Similarly, the demographic groups most similar to Danes are Colombian (2.3%, a difference of 0.010%), Immigrants from Jamaica (2.3%, a difference of 0.060%), Afghan (2.3%, a difference of 0.13%), Celtic (2.3%, a difference of 0.53%), and Czechoslovakian (2.3%, a difference of 0.79%).
| Demographics | Rating | Rank | Single Father Households |
| Canadians | 79.7 /100 | #157 | Good 2.3% |
| Immigrants | Senegal | 79.4 /100 | #158 | Good 2.3% |
| Immigrants | West Indies | 77.9 /100 | #159 | Good 2.3% |
| Immigrants | Bolivia | 76.3 /100 | #160 | Good 2.3% |
| Swiss | 73.2 /100 | #161 | Good 2.3% |
| Scottish | 72.8 /100 | #162 | Good 2.3% |
| Irish | 72.1 /100 | #163 | Good 2.3% |
| Pakistanis | 70.6 /100 | #164 | Good 2.3% |
| Scotch-Irish | 69.4 /100 | #165 | Good 2.3% |
| English | 68.6 /100 | #166 | Good 2.3% |
| South Americans | 64.3 /100 | #167 | Good 2.3% |
| Icelanders | 63.1 /100 | #168 | Good 2.3% |
| Czechs | 62.5 /100 | #169 | Good 2.3% |
| Ugandans | 62.2 /100 | #170 | Good 2.3% |
| Swedes | 61.6 /100 | #171 | Good 2.3% |
| Czechoslovakians | 58.9 /100 | #172 | Average 2.3% |
| Celtics | 55.4 /100 | #173 | Average 2.3% |
| Afghans | 50.0 /100 | #174 | Average 2.3% |
| Immigrants | Jamaica | 49.1 /100 | #175 | Average 2.3% |
| Danes | 48.2 /100 | #176 | Average 2.3% |
| Colombians | 48.0 /100 | #177 | Average 2.3% |