Immigrants from West Indies vs Immigrants from Japan 4 or more Vehicles in Household
COMPARE
Immigrants from West Indies
Immigrants from Japan
4 or more Vehicles in Household
4 or more Vehicles in Household Comparison
Immigrants from West Indies
Immigrants from Japan
4.7%
4 OR MORE VEHICLES IN HOUSEHOLD
0.0/ 100
METRIC RATING
314th/ 347
METRIC RANK
6.3%
4 OR MORE VEHICLES IN HOUSEHOLD
43.1/ 100
METRIC RATING
179th/ 347
METRIC RANK
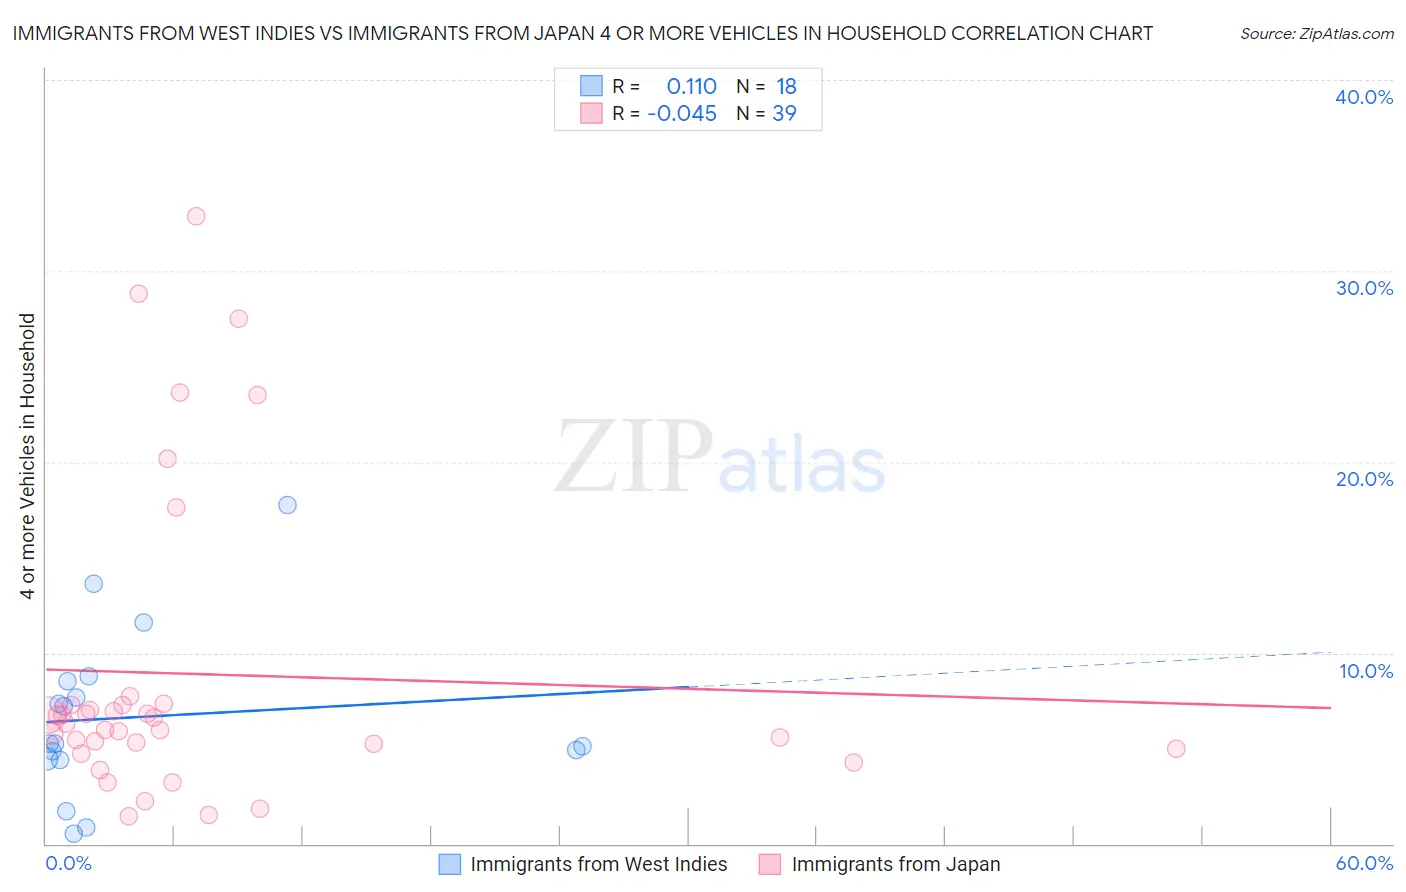
Immigrants from West Indies vs Immigrants from Japan 4 or more Vehicles in Household Correlation Chart
The statistical analysis conducted on geographies consisting of 72,052,209 people shows a poor positive correlation between the proportion of Immigrants from West Indies and percentage of households with 4 or more vehicles available in the United States with a correlation coefficient (R) of 0.110 and weighted average of 4.7%. Similarly, the statistical analysis conducted on geographies consisting of 338,505,499 people shows no correlation between the proportion of Immigrants from Japan and percentage of households with 4 or more vehicles available in the United States with a correlation coefficient (R) of -0.045 and weighted average of 6.3%, a difference of 32.3%.
4 or more Vehicles in Household Correlation Summary
| Measurement | Immigrants from West Indies | Immigrants from Japan |
| Minimum | 0.50% | 1.5% |
| Maximum | 17.7% | 32.8% |
| Range | 17.2% | 31.4% |
| Mean | 6.6% | 8.9% |
| Median | 5.3% | 6.3% |
| Interquartile 25% (IQ1) | 4.5% | 5.0% |
| Interquartile 75% (IQ3) | 8.5% | 7.3% |
| Interquartile Range (IQR) | 4.0% | 2.3% |
| Standard Deviation (Sample) | 4.4% | 8.0% |
| Standard Deviation (Population) | 4.2% | 7.9% |
Similar Demographics by 4 or more Vehicles in Household
Demographics Similar to Immigrants from West Indies by 4 or more Vehicles in Household
In terms of 4 or more vehicles in household, the demographic groups most similar to Immigrants from West Indies are Immigrants from Belarus (4.7%, a difference of 0.090%), Puerto Rican (4.7%, a difference of 0.53%), Immigrants from Israel (4.8%, a difference of 0.79%), Albanian (4.8%, a difference of 0.81%), and U.S. Virgin Islander (4.6%, a difference of 2.2%).
| Demographics | Rating | Rank | 4 or more Vehicles in Household |
| Menominee | 0.0 /100 | #307 | Tragic 5.0% |
| Paraguayans | 0.0 /100 | #308 | Tragic 4.9% |
| Immigrants | Somalia | 0.0 /100 | #309 | Tragic 4.9% |
| Moroccans | 0.0 /100 | #310 | Tragic 4.9% |
| Houma | 0.0 /100 | #311 | Tragic 4.9% |
| Albanians | 0.0 /100 | #312 | Tragic 4.8% |
| Immigrants | Israel | 0.0 /100 | #313 | Tragic 4.8% |
| Immigrants | West Indies | 0.0 /100 | #314 | Tragic 4.7% |
| Immigrants | Belarus | 0.0 /100 | #315 | Tragic 4.7% |
| Puerto Ricans | 0.0 /100 | #316 | Tragic 4.7% |
| U.S. Virgin Islanders | 0.0 /100 | #317 | Tragic 4.6% |
| Jamaicans | 0.0 /100 | #318 | Tragic 4.6% |
| Haitians | 0.0 /100 | #319 | Tragic 4.6% |
| Immigrants | Haiti | 0.0 /100 | #320 | Tragic 4.5% |
| Ecuadorians | 0.0 /100 | #321 | Tragic 4.5% |
Demographics Similar to Immigrants from Japan by 4 or more Vehicles in Household
In terms of 4 or more vehicles in household, the demographic groups most similar to Immigrants from Japan are Syrian (6.3%, a difference of 0.11%), Belizean (6.3%, a difference of 0.15%), Yugoslavian (6.3%, a difference of 0.20%), South American Indian (6.3%, a difference of 0.25%), and Slovak (6.3%, a difference of 0.39%).
| Demographics | Rating | Rank | 4 or more Vehicles in Household |
| Immigrants | Lebanon | 51.7 /100 | #172 | Average 6.3% |
| Slovenes | 51.1 /100 | #173 | Average 6.3% |
| Lithuanians | 50.0 /100 | #174 | Average 6.3% |
| Immigrants | Western Europe | 48.8 /100 | #175 | Average 6.3% |
| Ukrainians | 47.6 /100 | #176 | Average 6.3% |
| Slovaks | 46.9 /100 | #177 | Average 6.3% |
| Belizeans | 44.5 /100 | #178 | Average 6.3% |
| Immigrants | Japan | 43.1 /100 | #179 | Average 6.3% |
| Syrians | 42.0 /100 | #180 | Average 6.3% |
| Yugoslavians | 41.1 /100 | #181 | Average 6.3% |
| South American Indians | 40.7 /100 | #182 | Average 6.3% |
| Immigrants | Burma/Myanmar | 37.5 /100 | #183 | Fair 6.2% |
| Iraqis | 37.3 /100 | #184 | Fair 6.2% |
| Thais | 36.9 /100 | #185 | Fair 6.2% |
| Immigrants | Northern Europe | 36.8 /100 | #186 | Fair 6.2% |