Immigrants from Belize vs Immigrants from Kenya 4 or more Vehicles in Household
COMPARE
Immigrants from Belize
Immigrants from Kenya
4 or more Vehicles in Household
4 or more Vehicles in Household Comparison
Immigrants from Belize
Immigrants from Kenya
6.1%
4 OR MORE VEHICLES IN HOUSEHOLD
19.8/ 100
METRIC RATING
204th/ 347
METRIC RANK
6.0%
4 OR MORE VEHICLES IN HOUSEHOLD
9.2/ 100
METRIC RATING
223rd/ 347
METRIC RANK
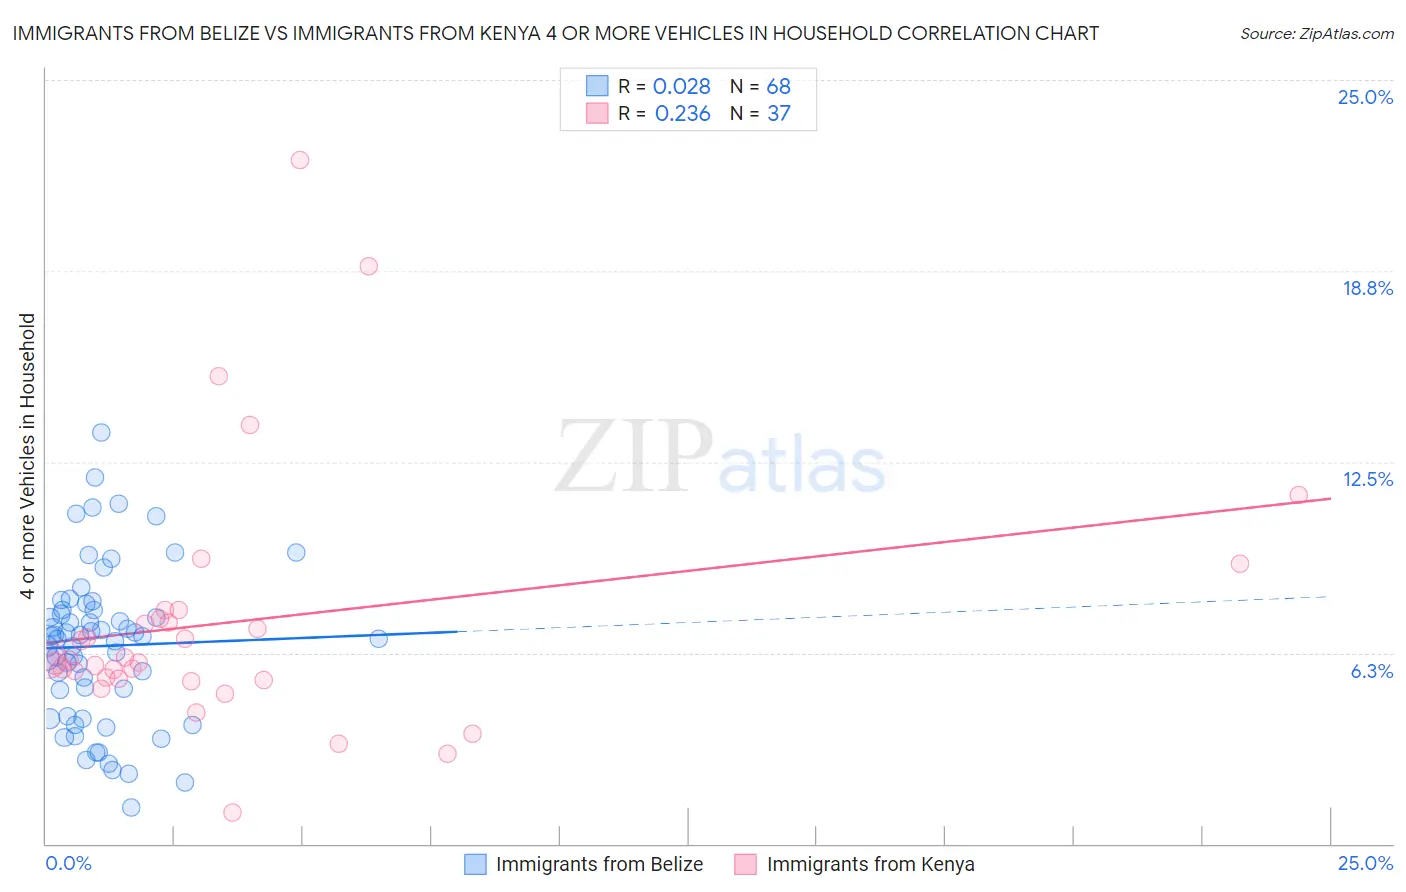
Immigrants from Belize vs Immigrants from Kenya 4 or more Vehicles in Household Correlation Chart
The statistical analysis conducted on geographies consisting of 129,765,587 people shows no correlation between the proportion of Immigrants from Belize and percentage of households with 4 or more vehicles available in the United States with a correlation coefficient (R) of 0.028 and weighted average of 6.1%. Similarly, the statistical analysis conducted on geographies consisting of 217,337,242 people shows a weak positive correlation between the proportion of Immigrants from Kenya and percentage of households with 4 or more vehicles available in the United States with a correlation coefficient (R) of 0.236 and weighted average of 6.0%, a difference of 2.4%.
4 or more Vehicles in Household Correlation Summary
| Measurement | Immigrants from Belize | Immigrants from Kenya |
| Minimum | 1.2% | 1.0% |
| Maximum | 13.4% | 22.4% |
| Range | 12.3% | 21.3% |
| Mean | 6.5% | 7.3% |
| Median | 6.8% | 6.0% |
| Interquartile 25% (IQ1) | 4.6% | 5.4% |
| Interquartile 75% (IQ3) | 7.6% | 7.5% |
| Interquartile Range (IQR) | 3.0% | 2.1% |
| Standard Deviation (Sample) | 2.5% | 4.2% |
| Standard Deviation (Population) | 2.5% | 4.1% |
Demographics Similar to Immigrants from Belize and Immigrants from Kenya by 4 or more Vehicles in Household
In terms of 4 or more vehicles in household, the demographic groups most similar to Immigrants from Belize are Honduran (6.1%, a difference of 0.090%), Immigrants from Sierra Leone (6.1%, a difference of 0.10%), Kenyan (6.1%, a difference of 0.23%), Immigrants from Chile (6.1%, a difference of 0.51%), and Immigrants from Nigeria (6.1%, a difference of 0.78%). Similarly, the demographic groups most similar to Immigrants from Kenya are Cajun (6.0%, a difference of 0.0%), Immigrants from Moldova (6.0%, a difference of 0.030%), Russian (6.0%, a difference of 0.33%), Immigrants from Italy (6.0%, a difference of 0.52%), and Serbian (6.0%, a difference of 0.52%).
| Demographics | Rating | Rank | 4 or more Vehicles in Household |
| Immigrants | Sierra Leone | 20.5 /100 | #203 | Fair 6.1% |
| Immigrants | Belize | 19.8 /100 | #204 | Poor 6.1% |
| Hondurans | 19.3 /100 | #205 | Poor 6.1% |
| Kenyans | 18.5 /100 | #206 | Poor 6.1% |
| Immigrants | Chile | 16.9 /100 | #207 | Poor 6.1% |
| Immigrants | Nigeria | 15.6 /100 | #208 | Poor 6.1% |
| Immigrants | Honduras | 15.4 /100 | #209 | Poor 6.1% |
| Immigrants | Zimbabwe | 15.1 /100 | #210 | Poor 6.0% |
| Panamanians | 14.8 /100 | #211 | Poor 6.0% |
| Immigrants | Egypt | 14.7 /100 | #212 | Poor 6.0% |
| Arabs | 14.4 /100 | #213 | Poor 6.0% |
| Immigrants | Austria | 14.3 /100 | #214 | Poor 6.0% |
| Immigrants | China | 13.8 /100 | #215 | Poor 6.0% |
| Immigrants | Romania | 13.8 /100 | #216 | Poor 6.0% |
| Nigerians | 12.2 /100 | #217 | Poor 6.0% |
| Immigrants | Italy | 11.0 /100 | #218 | Poor 6.0% |
| Serbians | 11.0 /100 | #219 | Poor 6.0% |
| Russians | 10.3 /100 | #220 | Poor 6.0% |
| Immigrants | Moldova | 9.3 /100 | #221 | Tragic 6.0% |
| Cajuns | 9.2 /100 | #222 | Tragic 6.0% |
| Immigrants | Kenya | 9.2 /100 | #223 | Tragic 6.0% |