Immigrants from Europe vs Immigrants from Kenya 4 or more Vehicles in Household
COMPARE
Immigrants from Europe
Immigrants from Kenya
4 or more Vehicles in Household
4 or more Vehicles in Household Comparison
Immigrants from Europe
Immigrants from Kenya
5.7%
4 OR MORE VEHICLES IN HOUSEHOLD
2.3/ 100
METRIC RATING
250th/ 347
METRIC RANK
6.0%
4 OR MORE VEHICLES IN HOUSEHOLD
9.2/ 100
METRIC RATING
223rd/ 347
METRIC RANK
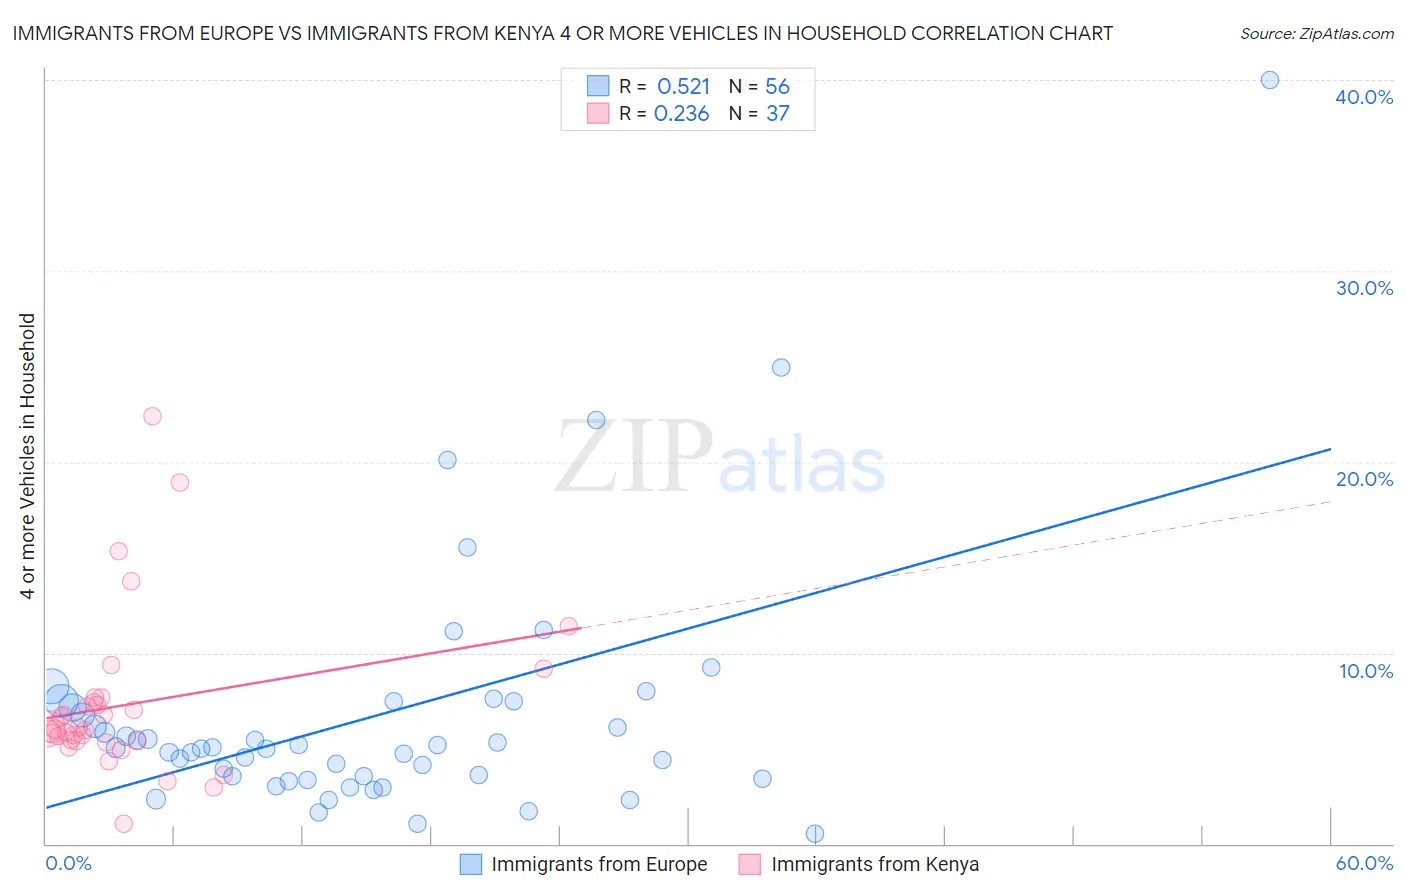
Immigrants from Europe vs Immigrants from Kenya 4 or more Vehicles in Household Correlation Chart
The statistical analysis conducted on geographies consisting of 544,257,144 people shows a substantial positive correlation between the proportion of Immigrants from Europe and percentage of households with 4 or more vehicles available in the United States with a correlation coefficient (R) of 0.521 and weighted average of 5.7%. Similarly, the statistical analysis conducted on geographies consisting of 217,337,242 people shows a weak positive correlation between the proportion of Immigrants from Kenya and percentage of households with 4 or more vehicles available in the United States with a correlation coefficient (R) of 0.236 and weighted average of 6.0%, a difference of 4.1%.
4 or more Vehicles in Household Correlation Summary
| Measurement | Immigrants from Europe | Immigrants from Kenya |
| Minimum | 0.50% | 1.0% |
| Maximum | 40.0% | 22.4% |
| Range | 39.5% | 21.3% |
| Mean | 6.7% | 7.3% |
| Median | 5.0% | 6.0% |
| Interquartile 25% (IQ1) | 3.5% | 5.4% |
| Interquartile 75% (IQ3) | 7.3% | 7.5% |
| Interquartile Range (IQR) | 3.8% | 2.1% |
| Standard Deviation (Sample) | 6.6% | 4.2% |
| Standard Deviation (Population) | 6.5% | 4.1% |
Similar Demographics by 4 or more Vehicles in Household
Demographics Similar to Immigrants from Europe by 4 or more Vehicles in Household
In terms of 4 or more vehicles in household, the demographic groups most similar to Immigrants from Europe are Ugandan (5.7%, a difference of 0.020%), Immigrants from Southern Europe (5.7%, a difference of 0.10%), Immigrants from Eastern Africa (5.7%, a difference of 0.12%), Immigrants from Ethiopia (5.7%, a difference of 0.23%), and Subsaharan African (5.7%, a difference of 0.25%).
| Demographics | Rating | Rank | 4 or more Vehicles in Household |
| Immigrants | Czechoslovakia | 3.2 /100 | #243 | Tragic 5.8% |
| Ethiopians | 3.2 /100 | #244 | Tragic 5.8% |
| Bulgarians | 3.1 /100 | #245 | Tragic 5.8% |
| Immigrants | North Macedonia | 2.5 /100 | #246 | Tragic 5.7% |
| Immigrants | Ethiopia | 2.4 /100 | #247 | Tragic 5.7% |
| Immigrants | Eastern Africa | 2.4 /100 | #248 | Tragic 5.7% |
| Immigrants | Southern Europe | 2.3 /100 | #249 | Tragic 5.7% |
| Immigrants | Europe | 2.3 /100 | #250 | Tragic 5.7% |
| Ugandans | 2.2 /100 | #251 | Tragic 5.7% |
| Sub-Saharan Africans | 2.1 /100 | #252 | Tragic 5.7% |
| Immigrants | Cuba | 1.6 /100 | #253 | Tragic 5.7% |
| Immigrants | Panama | 1.5 /100 | #254 | Tragic 5.7% |
| Yup'ik | 1.5 /100 | #255 | Tragic 5.7% |
| Immigrants | Turkey | 1.5 /100 | #256 | Tragic 5.7% |
| Immigrants | Northern Africa | 1.4 /100 | #257 | Tragic 5.6% |
Demographics Similar to Immigrants from Kenya by 4 or more Vehicles in Household
In terms of 4 or more vehicles in household, the demographic groups most similar to Immigrants from Kenya are Cajun (6.0%, a difference of 0.0%), Cuban (6.0%, a difference of 0.010%), Immigrants from Moldova (6.0%, a difference of 0.030%), Indonesian (6.0%, a difference of 0.090%), and Russian (6.0%, a difference of 0.33%).
| Demographics | Rating | Rank | 4 or more Vehicles in Household |
| Immigrants | Romania | 13.8 /100 | #216 | Poor 6.0% |
| Nigerians | 12.2 /100 | #217 | Poor 6.0% |
| Immigrants | Italy | 11.0 /100 | #218 | Poor 6.0% |
| Serbians | 11.0 /100 | #219 | Poor 6.0% |
| Russians | 10.3 /100 | #220 | Poor 6.0% |
| Immigrants | Moldova | 9.3 /100 | #221 | Tragic 6.0% |
| Cajuns | 9.2 /100 | #222 | Tragic 6.0% |
| Immigrants | Kenya | 9.2 /100 | #223 | Tragic 6.0% |
| Cubans | 9.2 /100 | #224 | Tragic 6.0% |
| Indonesians | 8.9 /100 | #225 | Tragic 6.0% |
| Immigrants | Singapore | 7.9 /100 | #226 | Tragic 5.9% |
| Immigrants | Western Asia | 7.8 /100 | #227 | Tragic 5.9% |
| Immigrants | Uganda | 7.5 /100 | #228 | Tragic 5.9% |
| Eastern Europeans | 6.8 /100 | #229 | Tragic 5.9% |
| Immigrants | Malaysia | 6.7 /100 | #230 | Tragic 5.9% |