Immigrants from Sudan vs Immigrants from Micronesia Unemployment
COMPARE
Immigrants from Sudan
Immigrants from Micronesia
Unemployment
Unemployment Comparison
Immigrants from Sudan
Immigrants from Micronesia
5.0%
UNEMPLOYMENT
96.3/ 100
METRIC RATING
91st/ 347
METRIC RANK
5.3%
UNEMPLOYMENT
25.2/ 100
METRIC RATING
203rd/ 347
METRIC RANK
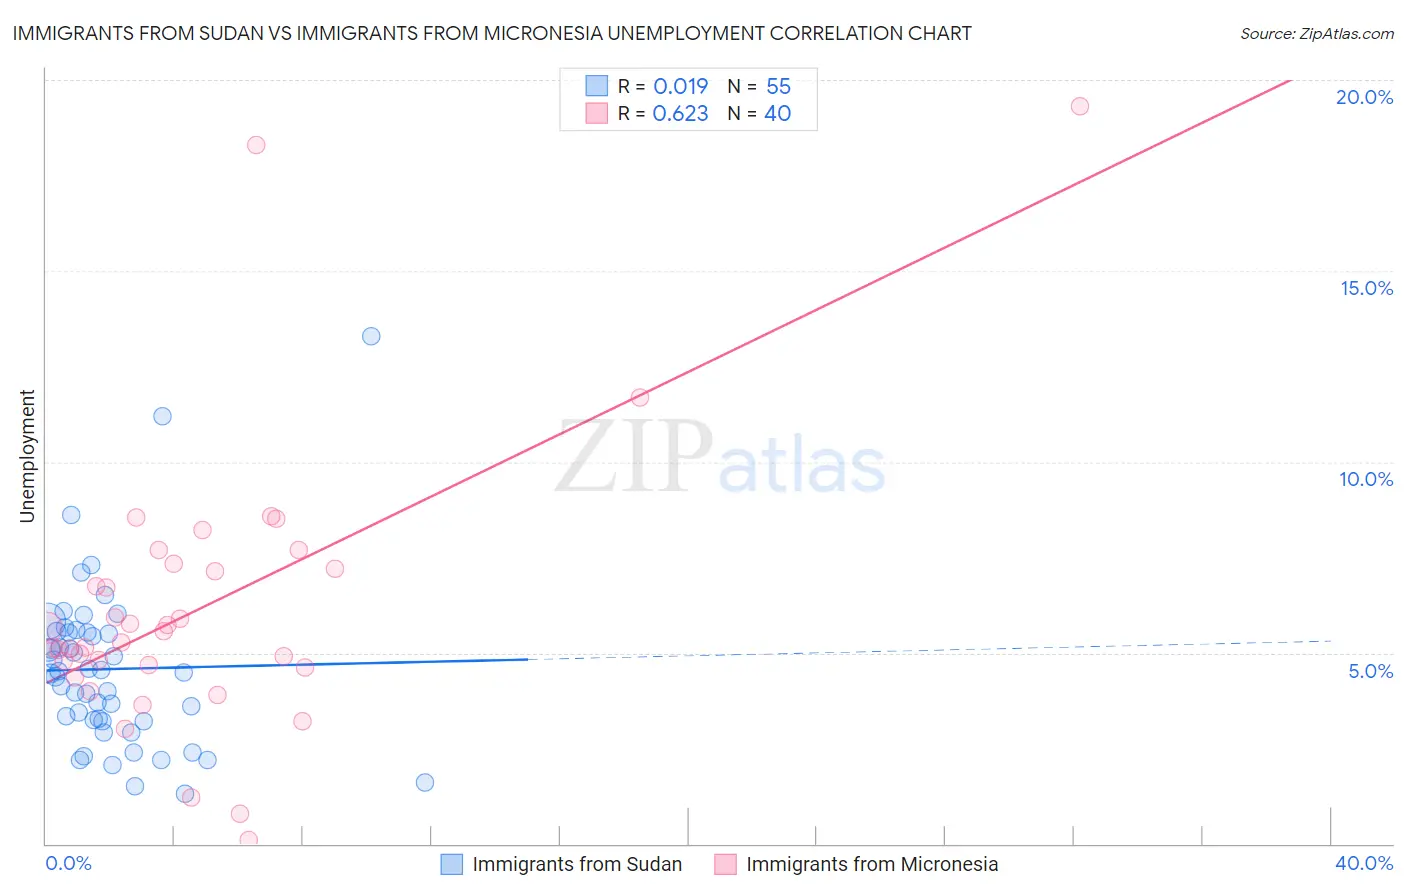
Immigrants from Sudan vs Immigrants from Micronesia Unemployment Correlation Chart
The statistical analysis conducted on geographies consisting of 118,944,450 people shows no correlation between the proportion of Immigrants from Sudan and unemployment in the United States with a correlation coefficient (R) of 0.019 and weighted average of 5.0%. Similarly, the statistical analysis conducted on geographies consisting of 61,596,499 people shows a significant positive correlation between the proportion of Immigrants from Micronesia and unemployment in the United States with a correlation coefficient (R) of 0.623 and weighted average of 5.3%, a difference of 7.0%.
Unemployment Correlation Summary
| Measurement | Immigrants from Sudan | Immigrants from Micronesia |
| Minimum | 1.3% | 0.10% |
| Maximum | 13.3% | 19.3% |
| Range | 12.0% | 19.2% |
| Mean | 4.6% | 6.2% |
| Median | 4.5% | 5.4% |
| Interquartile 25% (IQ1) | 3.2% | 4.6% |
| Interquartile 75% (IQ3) | 5.5% | 7.3% |
| Interquartile Range (IQR) | 2.3% | 2.6% |
| Standard Deviation (Sample) | 2.2% | 3.7% |
| Standard Deviation (Population) | 2.2% | 3.6% |
Similar Demographics by Unemployment
Demographics Similar to Immigrants from Sudan by Unemployment
In terms of unemployment, the demographic groups most similar to Immigrants from Sudan are Immigrants from North Macedonia (5.0%, a difference of 0.010%), Immigrants from South Africa (5.0%, a difference of 0.020%), Jordanian (5.0%, a difference of 0.050%), Ukrainian (5.0%, a difference of 0.11%), and Immigrants from Korea (5.0%, a difference of 0.14%).
| Demographics | Rating | Rank | Unemployment |
| Russians | 97.4 /100 | #84 | Exceptional 5.0% |
| Immigrants | Australia | 97.0 /100 | #85 | Exceptional 5.0% |
| Hungarians | 96.9 /100 | #86 | Exceptional 5.0% |
| Immigrants | Moldova | 96.6 /100 | #87 | Exceptional 5.0% |
| Immigrants | Korea | 96.6 /100 | #88 | Exceptional 5.0% |
| Jordanians | 96.4 /100 | #89 | Exceptional 5.0% |
| Immigrants | North Macedonia | 96.3 /100 | #90 | Exceptional 5.0% |
| Immigrants | Sudan | 96.3 /100 | #91 | Exceptional 5.0% |
| Immigrants | South Africa | 96.2 /100 | #92 | Exceptional 5.0% |
| Ukrainians | 96.0 /100 | #93 | Exceptional 5.0% |
| Immigrants | Austria | 95.9 /100 | #94 | Exceptional 5.0% |
| Immigrants | Serbia | 95.6 /100 | #95 | Exceptional 5.0% |
| Immigrants | England | 95.2 /100 | #96 | Exceptional 5.0% |
| Immigrants | Czechoslovakia | 95.1 /100 | #97 | Exceptional 5.0% |
| Romanians | 95.0 /100 | #98 | Exceptional 5.0% |
Demographics Similar to Immigrants from Micronesia by Unemployment
In terms of unemployment, the demographic groups most similar to Immigrants from Micronesia are Cherokee (5.3%, a difference of 0.030%), Immigrants from Ukraine (5.3%, a difference of 0.030%), Native Hawaiian (5.3%, a difference of 0.080%), Immigrants from South Eastern Asia (5.3%, a difference of 0.14%), and Korean (5.3%, a difference of 0.17%).
| Demographics | Rating | Rank | Unemployment |
| Peruvians | 29.9 /100 | #196 | Fair 5.3% |
| Immigrants | Uruguay | 29.8 /100 | #197 | Fair 5.3% |
| Immigrants | Israel | 28.6 /100 | #198 | Fair 5.3% |
| Immigrants | Afghanistan | 28.6 /100 | #199 | Fair 5.3% |
| Koreans | 27.4 /100 | #200 | Fair 5.3% |
| Immigrants | South Eastern Asia | 27.0 /100 | #201 | Fair 5.3% |
| Cherokee | 25.5 /100 | #202 | Fair 5.3% |
| Immigrants | Micronesia | 25.2 /100 | #203 | Fair 5.3% |
| Immigrants | Ukraine | 24.9 /100 | #204 | Fair 5.3% |
| Native Hawaiians | 24.1 /100 | #205 | Fair 5.3% |
| Immigrants | Peru | 22.7 /100 | #206 | Fair 5.4% |
| Creek | 19.4 /100 | #207 | Poor 5.4% |
| Portuguese | 19.0 /100 | #208 | Poor 5.4% |
| Immigrants | Iran | 18.8 /100 | #209 | Poor 5.4% |
| Immigrants | Iraq | 18.6 /100 | #210 | Poor 5.4% |