Armenian vs Eastern European 2 or more Vehicles in Household
COMPARE
Armenian
Eastern European
2 or more Vehicles in Household
2 or more Vehicles in Household Comparison
Armenians
Eastern Europeans
56.3%
2 OR MORE VEHICLES IN HOUSEHOLD
84.3/ 100
METRIC RATING
139th/ 347
METRIC RANK
54.8%
2 OR MORE VEHICLES IN HOUSEHOLD
27.5/ 100
METRIC RATING
189th/ 347
METRIC RANK
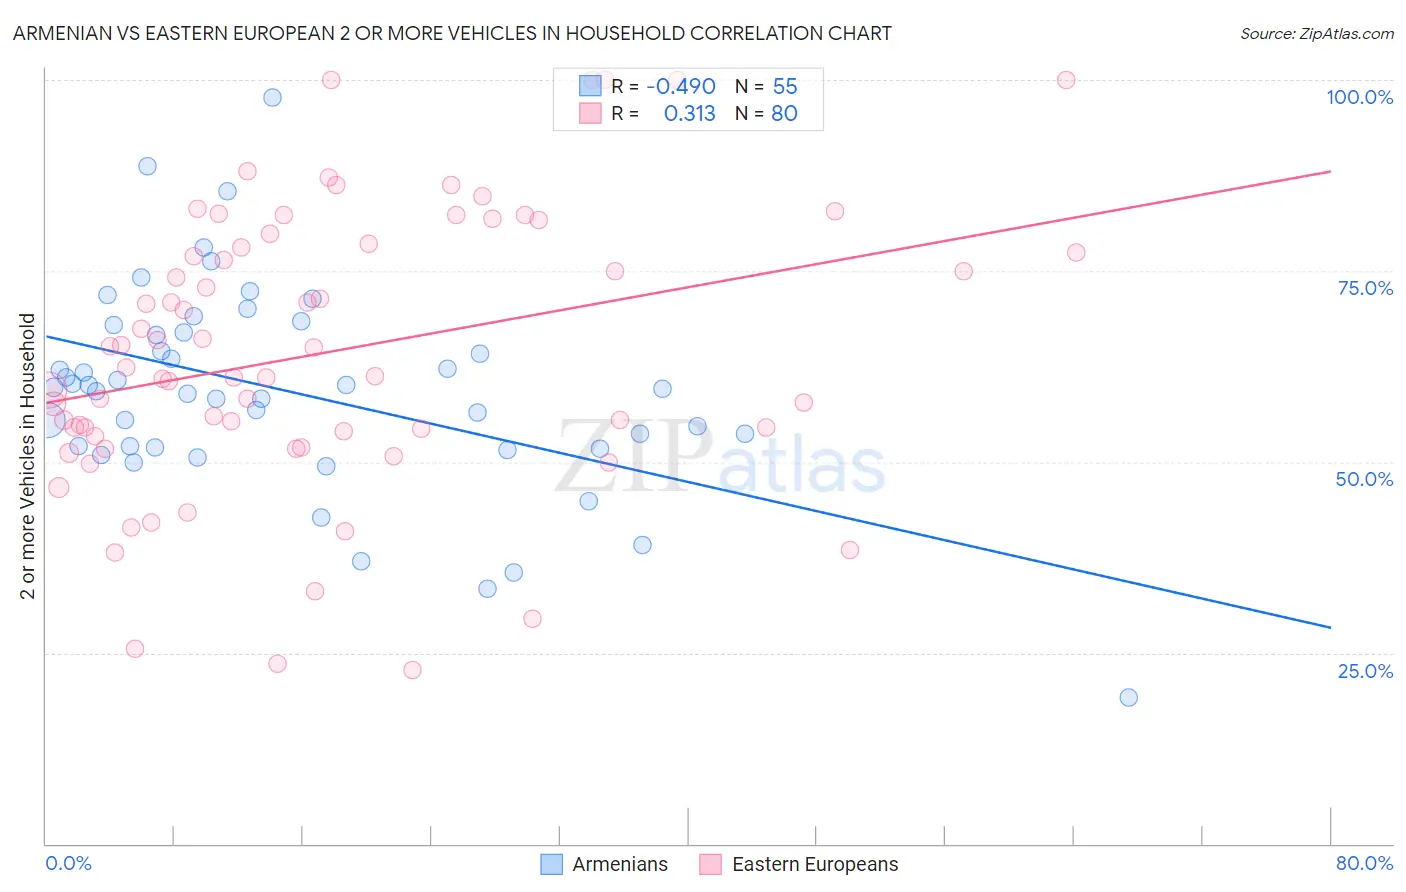
Armenian vs Eastern European 2 or more Vehicles in Household Correlation Chart
The statistical analysis conducted on geographies consisting of 310,821,659 people shows a moderate negative correlation between the proportion of Armenians and percentage of households with 2 or more vehicles available in the United States with a correlation coefficient (R) of -0.490 and weighted average of 56.3%. Similarly, the statistical analysis conducted on geographies consisting of 460,977,984 people shows a mild positive correlation between the proportion of Eastern Europeans and percentage of households with 2 or more vehicles available in the United States with a correlation coefficient (R) of 0.313 and weighted average of 54.8%, a difference of 2.7%.
2 or more Vehicles in Household Correlation Summary
| Measurement | Armenian | Eastern European |
| Minimum | 19.2% | 22.8% |
| Maximum | 97.7% | 100.0% |
| Range | 78.5% | 77.2% |
| Mean | 59.2% | 64.3% |
| Median | 59.5% | 61.9% |
| Interquartile 25% (IQ1) | 51.9% | 53.7% |
| Interquartile 75% (IQ3) | 67.0% | 78.3% |
| Interquartile Range (IQR) | 15.1% | 24.6% |
| Standard Deviation (Sample) | 13.6% | 18.3% |
| Standard Deviation (Population) | 13.4% | 18.2% |
Similar Demographics by 2 or more Vehicles in Household
Demographics Similar to Armenians by 2 or more Vehicles in Household
In terms of 2 or more vehicles in household, the demographic groups most similar to Armenians are Salvadoran (56.3%, a difference of 0.030%), Cuban (56.3%, a difference of 0.040%), Latvian (56.2%, a difference of 0.050%), Immigrants from Cambodia (56.2%, a difference of 0.050%), and South African (56.2%, a difference of 0.090%).
| Demographics | Rating | Rank | 2 or more Vehicles in Household |
| Hungarians | 89.1 /100 | #132 | Excellent 56.5% |
| Comanche | 88.4 /100 | #133 | Excellent 56.5% |
| Immigrants | Azores | 86.6 /100 | #134 | Excellent 56.4% |
| Blackfeet | 86.5 /100 | #135 | Excellent 56.4% |
| Immigrants | Asia | 86.0 /100 | #136 | Excellent 56.3% |
| Cubans | 84.8 /100 | #137 | Excellent 56.3% |
| Salvadorans | 84.7 /100 | #138 | Excellent 56.3% |
| Armenians | 84.3 /100 | #139 | Excellent 56.3% |
| Latvians | 83.6 /100 | #140 | Excellent 56.2% |
| Immigrants | Cambodia | 83.6 /100 | #141 | Excellent 56.2% |
| South Africans | 83.1 /100 | #142 | Excellent 56.2% |
| Seminole | 81.7 /100 | #143 | Excellent 56.2% |
| Immigrants | Syria | 81.4 /100 | #144 | Excellent 56.2% |
| Syrians | 81.2 /100 | #145 | Excellent 56.2% |
| Venezuelans | 80.7 /100 | #146 | Excellent 56.1% |
Demographics Similar to Eastern Europeans by 2 or more Vehicles in Household
In terms of 2 or more vehicles in household, the demographic groups most similar to Eastern Europeans are Russian (54.8%, a difference of 0.060%), Immigrants (54.7%, a difference of 0.13%), Marshallese (54.9%, a difference of 0.15%), Immigrants from Romania (54.7%, a difference of 0.20%), and Immigrants from Japan (54.7%, a difference of 0.22%).
| Demographics | Rating | Rank | 2 or more Vehicles in Household |
| Cree | 38.2 /100 | #182 | Fair 55.1% |
| Immigrants | Cameroon | 37.3 /100 | #183 | Fair 55.1% |
| Apache | 36.7 /100 | #184 | Fair 55.1% |
| Arabs | 35.9 /100 | #185 | Fair 55.0% |
| Peruvians | 33.7 /100 | #186 | Fair 55.0% |
| Immigrants | Uganda | 33.4 /100 | #187 | Fair 55.0% |
| Marshallese | 30.5 /100 | #188 | Fair 54.9% |
| Eastern Europeans | 27.5 /100 | #189 | Fair 54.8% |
| Russians | 26.3 /100 | #190 | Fair 54.8% |
| Immigrants | Immigrants | 25.0 /100 | #191 | Fair 54.7% |
| Immigrants | Romania | 23.8 /100 | #192 | Fair 54.7% |
| Immigrants | Japan | 23.4 /100 | #193 | Fair 54.7% |
| Central Americans | 23.0 /100 | #194 | Fair 54.7% |
| Iroquois | 22.6 /100 | #195 | Fair 54.7% |
| Immigrants | Poland | 19.3 /100 | #196 | Poor 54.6% |