Immigrants from Spain vs Immigrants from Albania 1 or more Vehicles in Household
COMPARE
Immigrants from Spain
Immigrants from Albania
1 or more Vehicles in Household
1 or more Vehicles in Household Comparison
Immigrants from Spain
Immigrants from Albania
85.8%
1 OR MORE VEHICLES IN HOUSEHOLD
0.0/ 100
METRIC RATING
296th/ 347
METRIC RANK
87.1%
1 OR MORE VEHICLES IN HOUSEHOLD
0.1/ 100
METRIC RATING
279th/ 347
METRIC RANK
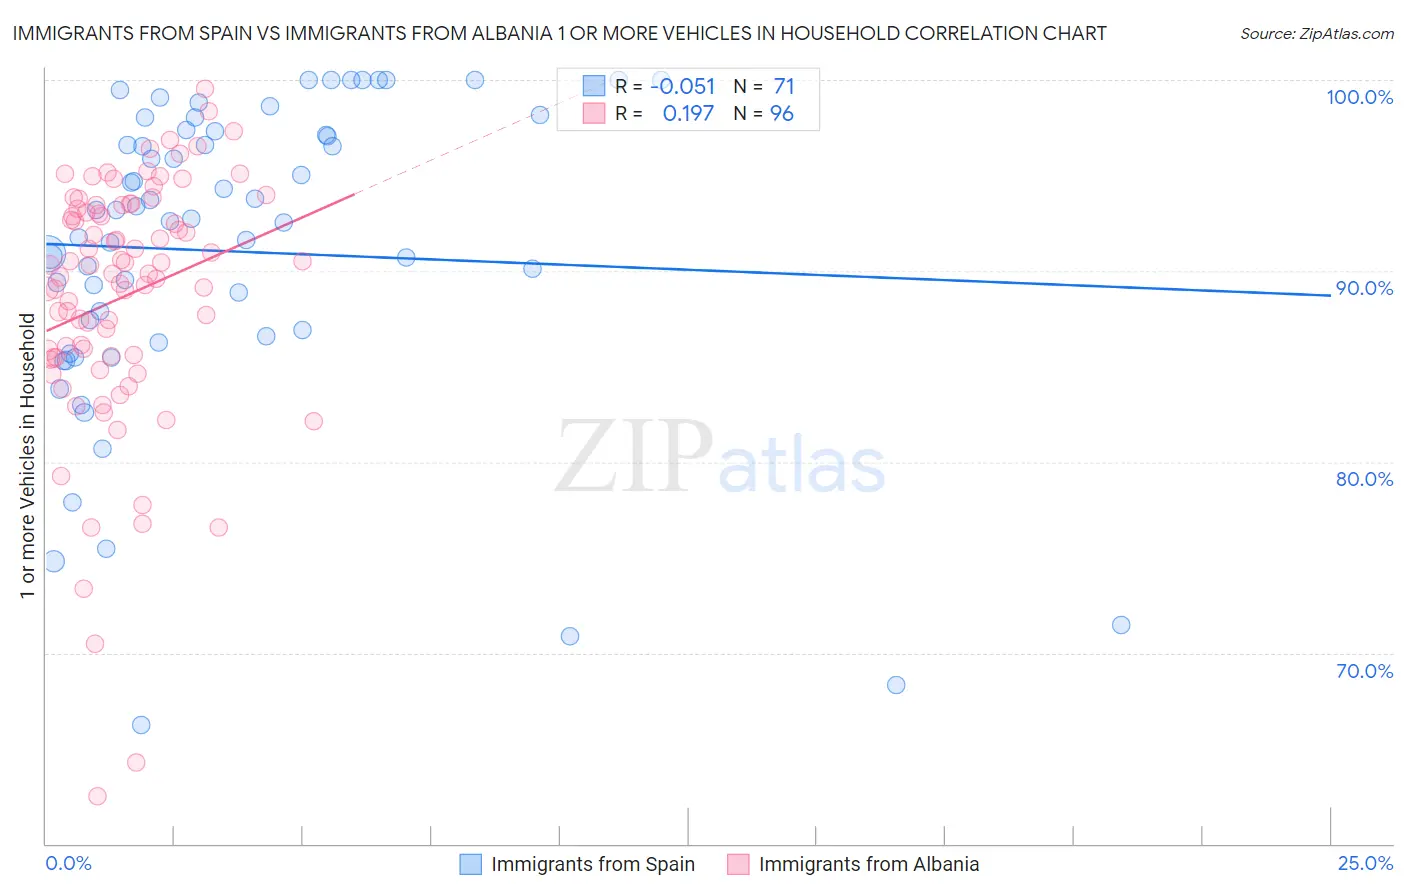
Immigrants from Spain vs Immigrants from Albania 1 or more Vehicles in Household Correlation Chart
The statistical analysis conducted on geographies consisting of 239,528,029 people shows a slight negative correlation between the proportion of Immigrants from Spain and percentage of households with 1 or more vehicles available in the United States with a correlation coefficient (R) of -0.051 and weighted average of 85.8%. Similarly, the statistical analysis conducted on geographies consisting of 107,656,140 people shows a poor positive correlation between the proportion of Immigrants from Albania and percentage of households with 1 or more vehicles available in the United States with a correlation coefficient (R) of 0.197 and weighted average of 87.1%, a difference of 1.5%.
1 or more Vehicles in Household Correlation Summary
| Measurement | Immigrants from Spain | Immigrants from Albania |
| Minimum | 66.2% | 62.5% |
| Maximum | 100.0% | 99.5% |
| Range | 33.8% | 37.0% |
| Mean | 91.0% | 88.6% |
| Median | 92.8% | 90.1% |
| Interquartile 25% (IQ1) | 86.6% | 85.5% |
| Interquartile 75% (IQ3) | 97.3% | 93.3% |
| Interquartile Range (IQR) | 10.8% | 7.8% |
| Standard Deviation (Sample) | 8.2% | 6.7% |
| Standard Deviation (Population) | 8.1% | 6.7% |
Demographics Similar to Immigrants from Spain and Immigrants from Albania by 1 or more Vehicles in Household
In terms of 1 or more vehicles in household, the demographic groups most similar to Immigrants from Spain are Immigrants from Jamaica (85.8%, a difference of 0.030%), Paraguayan (85.7%, a difference of 0.090%), Alaskan Athabascan (86.0%, a difference of 0.20%), Indian (Asian) (86.0%, a difference of 0.28%), and Okinawan (86.1%, a difference of 0.33%). Similarly, the demographic groups most similar to Immigrants from Albania are Immigrants from Southern Europe (87.1%, a difference of 0.0%), Immigrants from Croatia (87.0%, a difference of 0.030%), Alsatian (87.1%, a difference of 0.040%), Mongolian (87.0%, a difference of 0.090%), and Colville (86.8%, a difference of 0.32%).
| Demographics | Rating | Rank | 1 or more Vehicles in Household |
| Alsatians | 0.1 /100 | #277 | Tragic 87.1% |
| Immigrants | Southern Europe | 0.1 /100 | #278 | Tragic 87.1% |
| Immigrants | Albania | 0.1 /100 | #279 | Tragic 87.1% |
| Immigrants | Croatia | 0.0 /100 | #280 | Tragic 87.0% |
| Mongolians | 0.0 /100 | #281 | Tragic 87.0% |
| Colville | 0.0 /100 | #282 | Tragic 86.8% |
| Immigrants | Eastern Europe | 0.0 /100 | #283 | Tragic 86.7% |
| Central American Indians | 0.0 /100 | #284 | Tragic 86.7% |
| Immigrants | Kazakhstan | 0.0 /100 | #285 | Tragic 86.6% |
| Immigrants | Eastern Asia | 0.0 /100 | #286 | Tragic 86.5% |
| Immigrants | Malaysia | 0.0 /100 | #287 | Tragic 86.5% |
| Hopi | 0.0 /100 | #288 | Tragic 86.4% |
| Immigrants | Ireland | 0.0 /100 | #289 | Tragic 86.4% |
| Immigrants | Australia | 0.0 /100 | #290 | Tragic 86.4% |
| Pima | 0.0 /100 | #291 | Tragic 86.3% |
| Okinawans | 0.0 /100 | #292 | Tragic 86.1% |
| Indians (Asian) | 0.0 /100 | #293 | Tragic 86.0% |
| Alaskan Athabascans | 0.0 /100 | #294 | Tragic 86.0% |
| Immigrants | Jamaica | 0.0 /100 | #295 | Tragic 85.8% |
| Immigrants | Spain | 0.0 /100 | #296 | Tragic 85.8% |
| Paraguayans | 0.0 /100 | #297 | Tragic 85.7% |