Nicaraguan vs Immigrants from Albania 1 or more Vehicles in Household
COMPARE
Nicaraguan
Immigrants from Albania
1 or more Vehicles in Household
1 or more Vehicles in Household Comparison
Nicaraguans
Immigrants from Albania
90.4%
1 OR MORE VEHICLES IN HOUSEHOLD
88.8/ 100
METRIC RATING
130th/ 347
METRIC RANK
87.1%
1 OR MORE VEHICLES IN HOUSEHOLD
0.1/ 100
METRIC RATING
279th/ 347
METRIC RANK
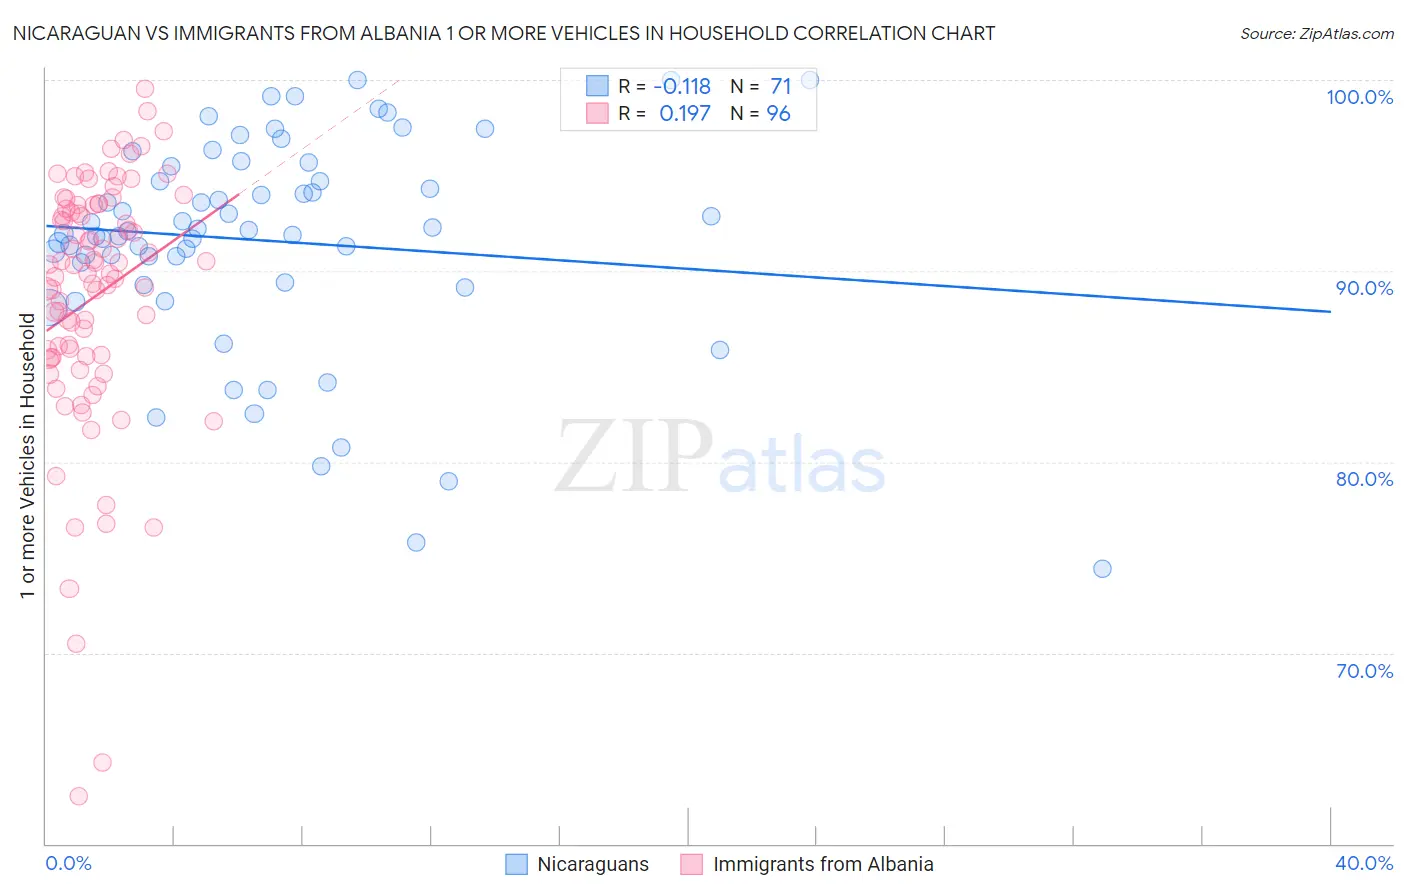
Nicaraguan vs Immigrants from Albania 1 or more Vehicles in Household Correlation Chart
The statistical analysis conducted on geographies consisting of 285,615,163 people shows a poor negative correlation between the proportion of Nicaraguans and percentage of households with 1 or more vehicles available in the United States with a correlation coefficient (R) of -0.118 and weighted average of 90.4%. Similarly, the statistical analysis conducted on geographies consisting of 107,656,140 people shows a poor positive correlation between the proportion of Immigrants from Albania and percentage of households with 1 or more vehicles available in the United States with a correlation coefficient (R) of 0.197 and weighted average of 87.1%, a difference of 3.9%.
1 or more Vehicles in Household Correlation Summary
| Measurement | Nicaraguan | Immigrants from Albania |
| Minimum | 74.4% | 62.5% |
| Maximum | 100.0% | 99.5% |
| Range | 25.6% | 37.0% |
| Mean | 91.6% | 88.6% |
| Median | 92.1% | 90.1% |
| Interquartile 25% (IQ1) | 89.4% | 85.5% |
| Interquartile 75% (IQ3) | 95.5% | 93.3% |
| Interquartile Range (IQR) | 6.1% | 7.8% |
| Standard Deviation (Sample) | 5.6% | 6.7% |
| Standard Deviation (Population) | 5.6% | 6.7% |
Similar Demographics by 1 or more Vehicles in Household
Demographics Similar to Nicaraguans by 1 or more Vehicles in Household
In terms of 1 or more vehicles in household, the demographic groups most similar to Nicaraguans are Marshallese (90.4%, a difference of 0.0%), Immigrants from the Azores (90.4%, a difference of 0.010%), Burmese (90.4%, a difference of 0.010%), Immigrants from Kenya (90.4%, a difference of 0.010%), and Immigrants from Cameroon (90.4%, a difference of 0.020%).
| Demographics | Rating | Rank | 1 or more Vehicles in Household |
| Fijians | 91.8 /100 | #123 | Exceptional 90.5% |
| Puget Sound Salish | 91.5 /100 | #124 | Exceptional 90.5% |
| Immigrants | Korea | 90.5 /100 | #125 | Exceptional 90.5% |
| Immigrants | Cameroon | 89.4 /100 | #126 | Excellent 90.4% |
| Immigrants | Azores | 89.1 /100 | #127 | Excellent 90.4% |
| Burmese | 89.0 /100 | #128 | Excellent 90.4% |
| Marshallese | 88.9 /100 | #129 | Excellent 90.4% |
| Nicaraguans | 88.8 /100 | #130 | Excellent 90.4% |
| Immigrants | Kenya | 88.5 /100 | #131 | Excellent 90.4% |
| Immigrants | South Africa | 88.1 /100 | #132 | Excellent 90.4% |
| Immigrants | Syria | 87.5 /100 | #133 | Excellent 90.4% |
| Kenyans | 87.0 /100 | #134 | Excellent 90.4% |
| Immigrants | Oceania | 86.9 /100 | #135 | Excellent 90.4% |
| Hungarians | 86.5 /100 | #136 | Excellent 90.3% |
| Latvians | 86.3 /100 | #137 | Excellent 90.3% |
Demographics Similar to Immigrants from Albania by 1 or more Vehicles in Household
In terms of 1 or more vehicles in household, the demographic groups most similar to Immigrants from Albania are Immigrants from Southern Europe (87.1%, a difference of 0.0%), Immigrants from Croatia (87.0%, a difference of 0.030%), Alsatian (87.1%, a difference of 0.040%), Mongolian (87.0%, a difference of 0.090%), and Immigrants from France (87.1%, a difference of 0.10%).
| Demographics | Rating | Rank | 1 or more Vehicles in Household |
| Aleuts | 0.2 /100 | #272 | Tragic 87.5% |
| Immigrants | Northern Africa | 0.2 /100 | #273 | Tragic 87.4% |
| Immigrants | Morocco | 0.1 /100 | #274 | Tragic 87.4% |
| Immigrants | Singapore | 0.1 /100 | #275 | Tragic 87.2% |
| Immigrants | France | 0.1 /100 | #276 | Tragic 87.1% |
| Alsatians | 0.1 /100 | #277 | Tragic 87.1% |
| Immigrants | Southern Europe | 0.1 /100 | #278 | Tragic 87.1% |
| Immigrants | Albania | 0.1 /100 | #279 | Tragic 87.1% |
| Immigrants | Croatia | 0.0 /100 | #280 | Tragic 87.0% |
| Mongolians | 0.0 /100 | #281 | Tragic 87.0% |
| Colville | 0.0 /100 | #282 | Tragic 86.8% |
| Immigrants | Eastern Europe | 0.0 /100 | #283 | Tragic 86.7% |
| Central American Indians | 0.0 /100 | #284 | Tragic 86.7% |
| Immigrants | Kazakhstan | 0.0 /100 | #285 | Tragic 86.6% |
| Immigrants | Eastern Asia | 0.0 /100 | #286 | Tragic 86.5% |