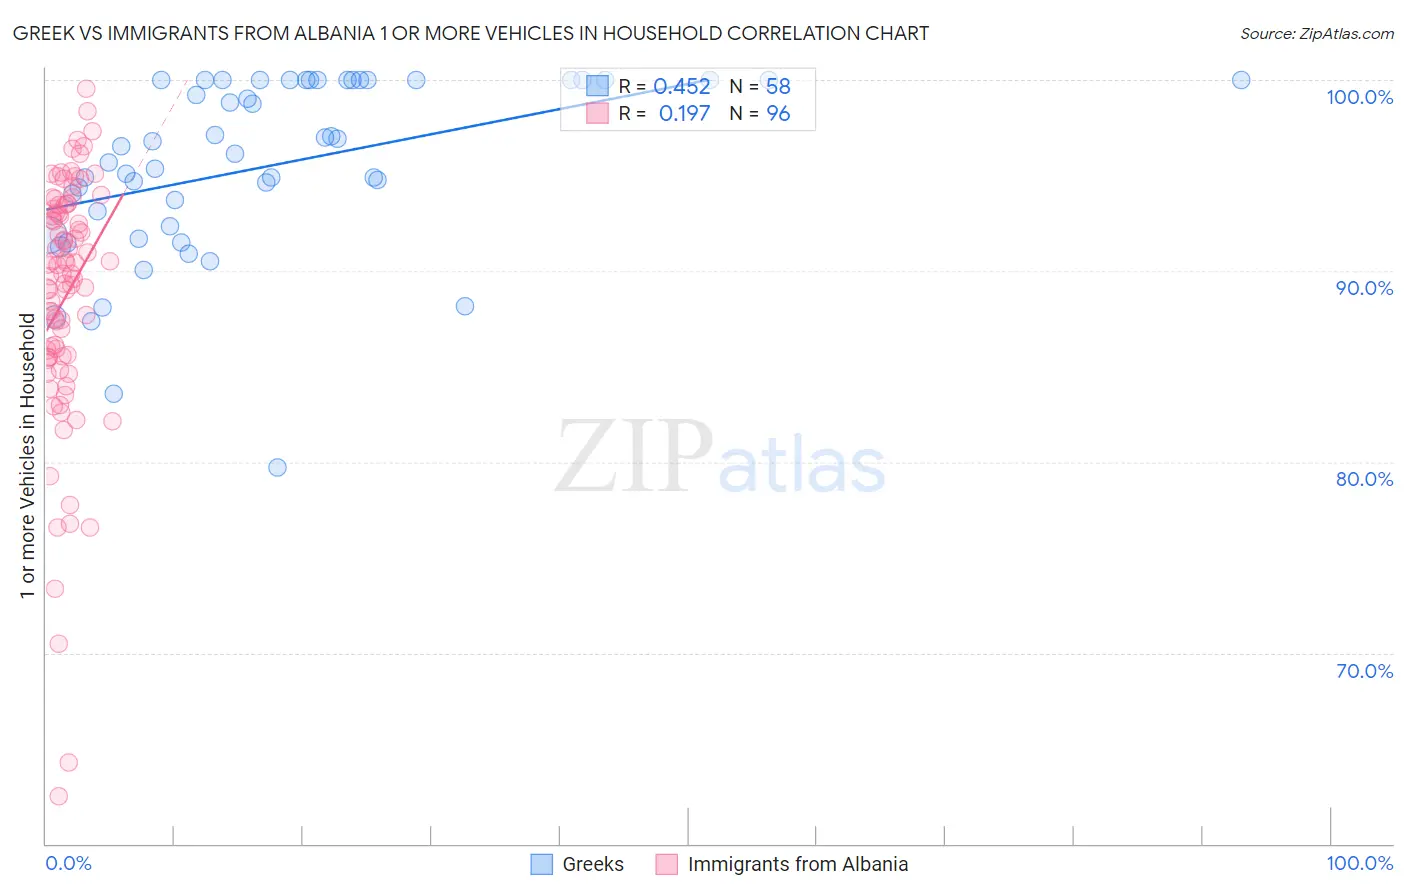
Greek vs Immigrants from Albania 1 or more Vehicles in Household
COMPARE
Greek
Immigrants from Albania
1 or more Vehicles in Household
1 or more Vehicles in Household Comparison
Greeks
Immigrants from Albania
90.6%
1 OR MORE VEHICLES IN HOUSEHOLD
93.5/ 100
METRIC RATING
117th/ 347
METRIC RANK
87.1%
1 OR MORE VEHICLES IN HOUSEHOLD
0.1/ 100
METRIC RATING
279th/ 347
METRIC RANK
Greek vs Immigrants from Albania 1 or more Vehicles in Household Correlation Chart
The statistical analysis conducted on geographies consisting of 482,364,894 people shows a moderate positive correlation between the proportion of Greeks and percentage of households with 1 or more vehicles available in the United States with a correlation coefficient (R) of 0.452 and weighted average of 90.6%. Similarly, the statistical analysis conducted on geographies consisting of 107,656,140 people shows a poor positive correlation between the proportion of Immigrants from Albania and percentage of households with 1 or more vehicles available in the United States with a correlation coefficient (R) of 0.197 and weighted average of 87.1%, a difference of 4.1%.
1 or more Vehicles in Household Correlation Summary
| Measurement | Greek | Immigrants from Albania |
| Minimum | 79.7% | 62.5% |
| Maximum | 100.0% | 99.5% |
| Range | 20.3% | 37.0% |
| Mean | 95.5% | 88.6% |
| Median | 96.3% | 90.1% |
| Interquartile 25% (IQ1) | 92.4% | 85.5% |
| Interquartile 75% (IQ3) | 100.0% | 93.3% |
| Interquartile Range (IQR) | 7.6% | 7.8% |
| Standard Deviation (Sample) | 4.7% | 6.7% |
| Standard Deviation (Population) | 4.7% | 6.7% |
Similar Demographics by 1 or more Vehicles in Household
Demographics Similar to Greeks by 1 or more Vehicles in Household
In terms of 1 or more vehicles in household, the demographic groups most similar to Greeks are Japanese (90.6%, a difference of 0.010%), Serbian (90.7%, a difference of 0.050%), Chippewa (90.7%, a difference of 0.050%), Blackfeet (90.6%, a difference of 0.050%), and Armenian (90.7%, a difference of 0.070%).
| Demographics | Rating | Rank | 1 or more Vehicles in Household |
| Mexican American Indians | 97.4 /100 | #110 | Exceptional 91.0% |
| Navajo | 95.8 /100 | #111 | Exceptional 90.8% |
| Immigrants | Netherlands | 95.7 /100 | #112 | Exceptional 90.8% |
| Immigrants | Kuwait | 94.7 /100 | #113 | Exceptional 90.7% |
| Armenians | 94.5 /100 | #114 | Exceptional 90.7% |
| Serbians | 94.3 /100 | #115 | Exceptional 90.7% |
| Chippewa | 94.3 /100 | #116 | Exceptional 90.7% |
| Greeks | 93.5 /100 | #117 | Exceptional 90.6% |
| Japanese | 93.4 /100 | #118 | Exceptional 90.6% |
| Blackfeet | 92.6 /100 | #119 | Exceptional 90.6% |
| Immigrants | Thailand | 92.3 /100 | #120 | Exceptional 90.6% |
| Icelanders | 92.1 /100 | #121 | Exceptional 90.5% |
| Costa Ricans | 92.0 /100 | #122 | Exceptional 90.5% |
| Fijians | 91.8 /100 | #123 | Exceptional 90.5% |
| Puget Sound Salish | 91.5 /100 | #124 | Exceptional 90.5% |
Demographics Similar to Immigrants from Albania by 1 or more Vehicles in Household
In terms of 1 or more vehicles in household, the demographic groups most similar to Immigrants from Albania are Immigrants from Southern Europe (87.1%, a difference of 0.0%), Immigrants from Croatia (87.0%, a difference of 0.030%), Alsatian (87.1%, a difference of 0.040%), Mongolian (87.0%, a difference of 0.090%), and Immigrants from France (87.1%, a difference of 0.10%).
| Demographics | Rating | Rank | 1 or more Vehicles in Household |
| Aleuts | 0.2 /100 | #272 | Tragic 87.5% |
| Immigrants | Northern Africa | 0.2 /100 | #273 | Tragic 87.4% |
| Immigrants | Morocco | 0.1 /100 | #274 | Tragic 87.4% |
| Immigrants | Singapore | 0.1 /100 | #275 | Tragic 87.2% |
| Immigrants | France | 0.1 /100 | #276 | Tragic 87.1% |
| Alsatians | 0.1 /100 | #277 | Tragic 87.1% |
| Immigrants | Southern Europe | 0.1 /100 | #278 | Tragic 87.1% |
| Immigrants | Albania | 0.1 /100 | #279 | Tragic 87.1% |
| Immigrants | Croatia | 0.0 /100 | #280 | Tragic 87.0% |
| Mongolians | 0.0 /100 | #281 | Tragic 87.0% |
| Colville | 0.0 /100 | #282 | Tragic 86.8% |
| Immigrants | Eastern Europe | 0.0 /100 | #283 | Tragic 86.7% |
| Central American Indians | 0.0 /100 | #284 | Tragic 86.7% |
| Immigrants | Kazakhstan | 0.0 /100 | #285 | Tragic 86.6% |
| Immigrants | Eastern Asia | 0.0 /100 | #286 | Tragic 86.5% |