Uruguayan vs Immigrants from Netherlands 3 or more Vehicles in Household
COMPARE
Uruguayan
Immigrants from Netherlands
3 or more Vehicles in Household
3 or more Vehicles in Household Comparison
Uruguayans
Immigrants from Netherlands
17.8%
3 OR MORE VEHICLES IN HOUSEHOLD
1.0/ 100
METRIC RATING
259th/ 347
METRIC RANK
20.4%
3 OR MORE VEHICLES IN HOUSEHOLD
92.9/ 100
METRIC RATING
125th/ 347
METRIC RANK
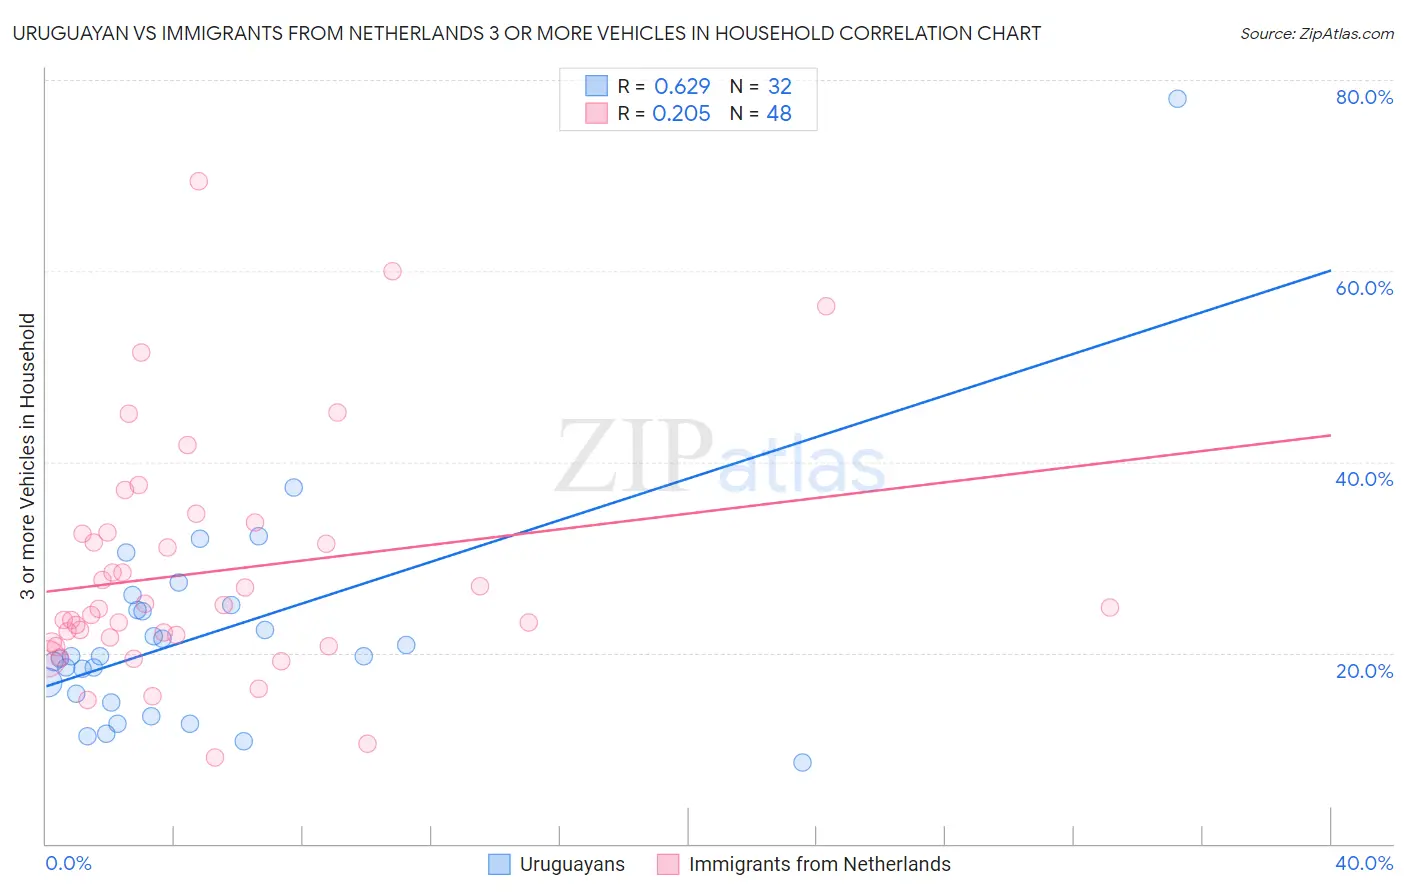
Uruguayan vs Immigrants from Netherlands 3 or more Vehicles in Household Correlation Chart
The statistical analysis conducted on geographies consisting of 144,743,847 people shows a significant positive correlation between the proportion of Uruguayans and percentage of households with 3 or more vehicles available in the United States with a correlation coefficient (R) of 0.629 and weighted average of 17.8%. Similarly, the statistical analysis conducted on geographies consisting of 237,758,469 people shows a weak positive correlation between the proportion of Immigrants from Netherlands and percentage of households with 3 or more vehicles available in the United States with a correlation coefficient (R) of 0.205 and weighted average of 20.4%, a difference of 14.8%.
3 or more Vehicles in Household Correlation Summary
| Measurement | Uruguayan | Immigrants from Netherlands |
| Minimum | 8.6% | 9.0% |
| Maximum | 78.0% | 69.4% |
| Range | 69.5% | 60.4% |
| Mean | 22.0% | 28.4% |
| Median | 19.7% | 24.7% |
| Interquartile 25% (IQ1) | 15.3% | 21.4% |
| Interquartile 75% (IQ3) | 24.7% | 32.5% |
| Interquartile Range (IQR) | 9.4% | 11.2% |
| Standard Deviation (Sample) | 12.3% | 12.3% |
| Standard Deviation (Population) | 12.1% | 12.2% |
Similar Demographics by 3 or more Vehicles in Household
Demographics Similar to Uruguayans by 3 or more Vehicles in Household
In terms of 3 or more vehicles in household, the demographic groups most similar to Uruguayans are Ugandan (17.8%, a difference of 0.13%), Immigrants from Northern Africa (17.8%, a difference of 0.15%), Colombian (17.8%, a difference of 0.18%), Immigrants from Eritrea (17.8%, a difference of 0.22%), and Sudanese (17.8%, a difference of 0.22%).
| Demographics | Rating | Rank | 3 or more Vehicles in Household |
| Immigrants | Southern Europe | 1.4 /100 | #252 | Tragic 17.9% |
| Immigrants | Ethiopia | 1.3 /100 | #253 | Tragic 17.9% |
| Ethiopians | 1.2 /100 | #254 | Tragic 17.9% |
| Immigrants | Turkey | 1.2 /100 | #255 | Tragic 17.9% |
| Sub-Saharan Africans | 1.1 /100 | #256 | Tragic 17.9% |
| Immigrants | Eritrea | 1.1 /100 | #257 | Tragic 17.8% |
| Sudanese | 1.1 /100 | #258 | Tragic 17.8% |
| Uruguayans | 1.0 /100 | #259 | Tragic 17.8% |
| Ugandans | 0.9 /100 | #260 | Tragic 17.8% |
| Immigrants | Northern Africa | 0.9 /100 | #261 | Tragic 17.8% |
| Colombians | 0.9 /100 | #262 | Tragic 17.8% |
| Bermudans | 0.9 /100 | #263 | Tragic 17.8% |
| Cambodians | 0.9 /100 | #264 | Tragic 17.8% |
| Immigrants | Panama | 0.8 /100 | #265 | Tragic 17.7% |
| Macedonians | 0.8 /100 | #266 | Tragic 17.7% |
Demographics Similar to Immigrants from Netherlands by 3 or more Vehicles in Household
In terms of 3 or more vehicles in household, the demographic groups most similar to Immigrants from Netherlands are Central American (20.5%, a difference of 0.030%), Immigrants from Korea (20.5%, a difference of 0.20%), German Russian (20.5%, a difference of 0.21%), Slavic (20.4%, a difference of 0.21%), and Immigrants from Thailand (20.5%, a difference of 0.25%).
| Demographics | Rating | Rank | 3 or more Vehicles in Household |
| Costa Ricans | 94.6 /100 | #118 | Exceptional 20.6% |
| Immigrants | Latin America | 94.5 /100 | #119 | Exceptional 20.5% |
| Maltese | 93.9 /100 | #120 | Exceptional 20.5% |
| Immigrants | Thailand | 93.8 /100 | #121 | Exceptional 20.5% |
| German Russians | 93.7 /100 | #122 | Exceptional 20.5% |
| Immigrants | Korea | 93.7 /100 | #123 | Exceptional 20.5% |
| Central Americans | 93.1 /100 | #124 | Exceptional 20.5% |
| Immigrants | Netherlands | 92.9 /100 | #125 | Exceptional 20.4% |
| Slavs | 92.1 /100 | #126 | Exceptional 20.4% |
| Immigrants | Bolivia | 92.0 /100 | #127 | Exceptional 20.4% |
| New Zealanders | 91.3 /100 | #128 | Exceptional 20.4% |
| Zimbabweans | 88.7 /100 | #129 | Excellent 20.3% |
| Greeks | 88.6 /100 | #130 | Excellent 20.3% |
| Immigrants | Asia | 88.1 /100 | #131 | Excellent 20.2% |
| Immigrants | Canada | 87.8 /100 | #132 | Excellent 20.2% |