Immigrants from Serbia vs Spanish American Indian 2 or more Vehicles in Household
COMPARE
Immigrants from Serbia
Spanish American Indian
2 or more Vehicles in Household
2 or more Vehicles in Household Comparison
Immigrants from Serbia
Spanish American Indians
51.3%
2 OR MORE VEHICLES IN HOUSEHOLD
0.1/ 100
METRIC RATING
287th/ 347
METRIC RANK
60.3%
2 OR MORE VEHICLES IN HOUSEHOLD
100.0/ 100
METRIC RATING
31st/ 347
METRIC RANK
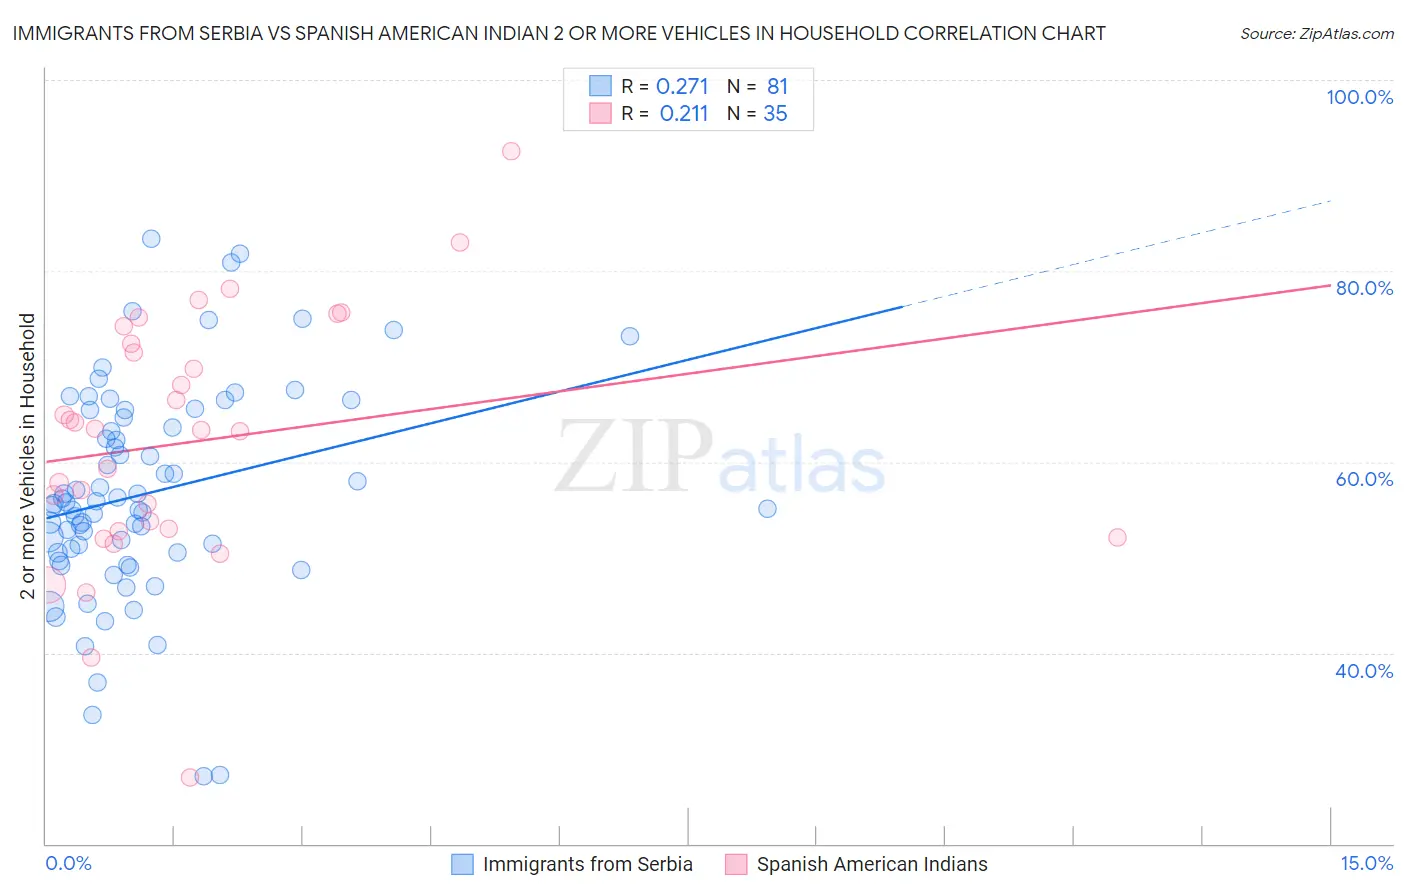
Immigrants from Serbia vs Spanish American Indian 2 or more Vehicles in Household Correlation Chart
The statistical analysis conducted on geographies consisting of 131,726,431 people shows a weak positive correlation between the proportion of Immigrants from Serbia and percentage of households with 2 or more vehicles available in the United States with a correlation coefficient (R) of 0.271 and weighted average of 51.3%. Similarly, the statistical analysis conducted on geographies consisting of 73,145,550 people shows a weak positive correlation between the proportion of Spanish American Indians and percentage of households with 2 or more vehicles available in the United States with a correlation coefficient (R) of 0.211 and weighted average of 60.3%, a difference of 17.6%.
2 or more Vehicles in Household Correlation Summary
| Measurement | Immigrants from Serbia | Spanish American Indian |
| Minimum | 27.0% | 27.0% |
| Maximum | 83.4% | 92.6% |
| Range | 56.4% | 65.6% |
| Mean | 56.7% | 62.1% |
| Median | 55.6% | 63.3% |
| Interquartile 25% (IQ1) | 50.5% | 52.7% |
| Interquartile 75% (IQ3) | 65.0% | 72.3% |
| Interquartile Range (IQR) | 14.5% | 19.7% |
| Standard Deviation (Sample) | 11.1% | 13.2% |
| Standard Deviation (Population) | 11.1% | 13.0% |
Similar Demographics by 2 or more Vehicles in Household
Demographics Similar to Immigrants from Serbia by 2 or more Vehicles in Household
In terms of 2 or more vehicles in household, the demographic groups most similar to Immigrants from Serbia are Immigrants from Liberia (51.3%, a difference of 0.020%), Okinawan (51.2%, a difference of 0.12%), Immigrants from Uruguay (51.4%, a difference of 0.17%), Immigrants from Zaire (51.5%, a difference of 0.33%), and Immigrants from China (51.5%, a difference of 0.37%).
| Demographics | Rating | Rank | 2 or more Vehicles in Household |
| Immigrants | Eastern Europe | 0.1 /100 | #280 | Tragic 51.7% |
| Immigrants | Kazakhstan | 0.1 /100 | #281 | Tragic 51.6% |
| Bahamians | 0.1 /100 | #282 | Tragic 51.5% |
| Immigrants | China | 0.1 /100 | #283 | Tragic 51.5% |
| Immigrants | Zaire | 0.1 /100 | #284 | Tragic 51.5% |
| Immigrants | Uruguay | 0.1 /100 | #285 | Tragic 51.4% |
| Immigrants | Liberia | 0.1 /100 | #286 | Tragic 51.3% |
| Immigrants | Serbia | 0.1 /100 | #287 | Tragic 51.3% |
| Okinawans | 0.1 /100 | #288 | Tragic 51.2% |
| Somalis | 0.0 /100 | #289 | Tragic 51.1% |
| Immigrants | Panama | 0.0 /100 | #290 | Tragic 51.1% |
| Belizeans | 0.0 /100 | #291 | Tragic 51.0% |
| Immigrants | Ukraine | 0.0 /100 | #292 | Tragic 50.9% |
| Blacks/African Americans | 0.0 /100 | #293 | Tragic 50.9% |
| Bermudans | 0.0 /100 | #294 | Tragic 50.6% |
Demographics Similar to Spanish American Indians by 2 or more Vehicles in Household
In terms of 2 or more vehicles in household, the demographic groups most similar to Spanish American Indians are Finnish (60.3%, a difference of 0.030%), Arapaho (60.2%, a difference of 0.11%), Hawaiian (60.4%, a difference of 0.16%), Immigrants from Mexico (60.2%, a difference of 0.16%), and Spanish (60.2%, a difference of 0.22%).
| Demographics | Rating | Rank | 2 or more Vehicles in Household |
| Immigrants | Vietnam | 100.0 /100 | #24 | Exceptional 60.9% |
| Whites/Caucasians | 100.0 /100 | #25 | Exceptional 60.8% |
| Welsh | 100.0 /100 | #26 | Exceptional 60.8% |
| Assyrians/Chaldeans/Syriacs | 100.0 /100 | #27 | Exceptional 60.5% |
| Guamanians/Chamorros | 100.0 /100 | #28 | Exceptional 60.5% |
| Hawaiians | 100.0 /100 | #29 | Exceptional 60.4% |
| Finns | 100.0 /100 | #30 | Exceptional 60.3% |
| Spanish American Indians | 100.0 /100 | #31 | Exceptional 60.3% |
| Arapaho | 100.0 /100 | #32 | Exceptional 60.2% |
| Immigrants | Mexico | 100.0 /100 | #33 | Exceptional 60.2% |
| Spanish | 100.0 /100 | #34 | Exceptional 60.2% |
| Immigrants | Philippines | 100.0 /100 | #35 | Exceptional 60.1% |
| Chinese | 100.0 /100 | #36 | Exceptional 60.1% |
| Irish | 100.0 /100 | #37 | Exceptional 60.1% |
| Americans | 100.0 /100 | #38 | Exceptional 60.0% |