Immigrants from Serbia vs Maltese 2 or more Vehicles in Household
COMPARE
Immigrants from Serbia
Maltese
2 or more Vehicles in Household
2 or more Vehicles in Household Comparison
Immigrants from Serbia
Maltese
51.3%
2 OR MORE VEHICLES IN HOUSEHOLD
0.1/ 100
METRIC RATING
287th/ 347
METRIC RANK
58.0%
2 OR MORE VEHICLES IN HOUSEHOLD
99.2/ 100
METRIC RATING
84th/ 347
METRIC RANK
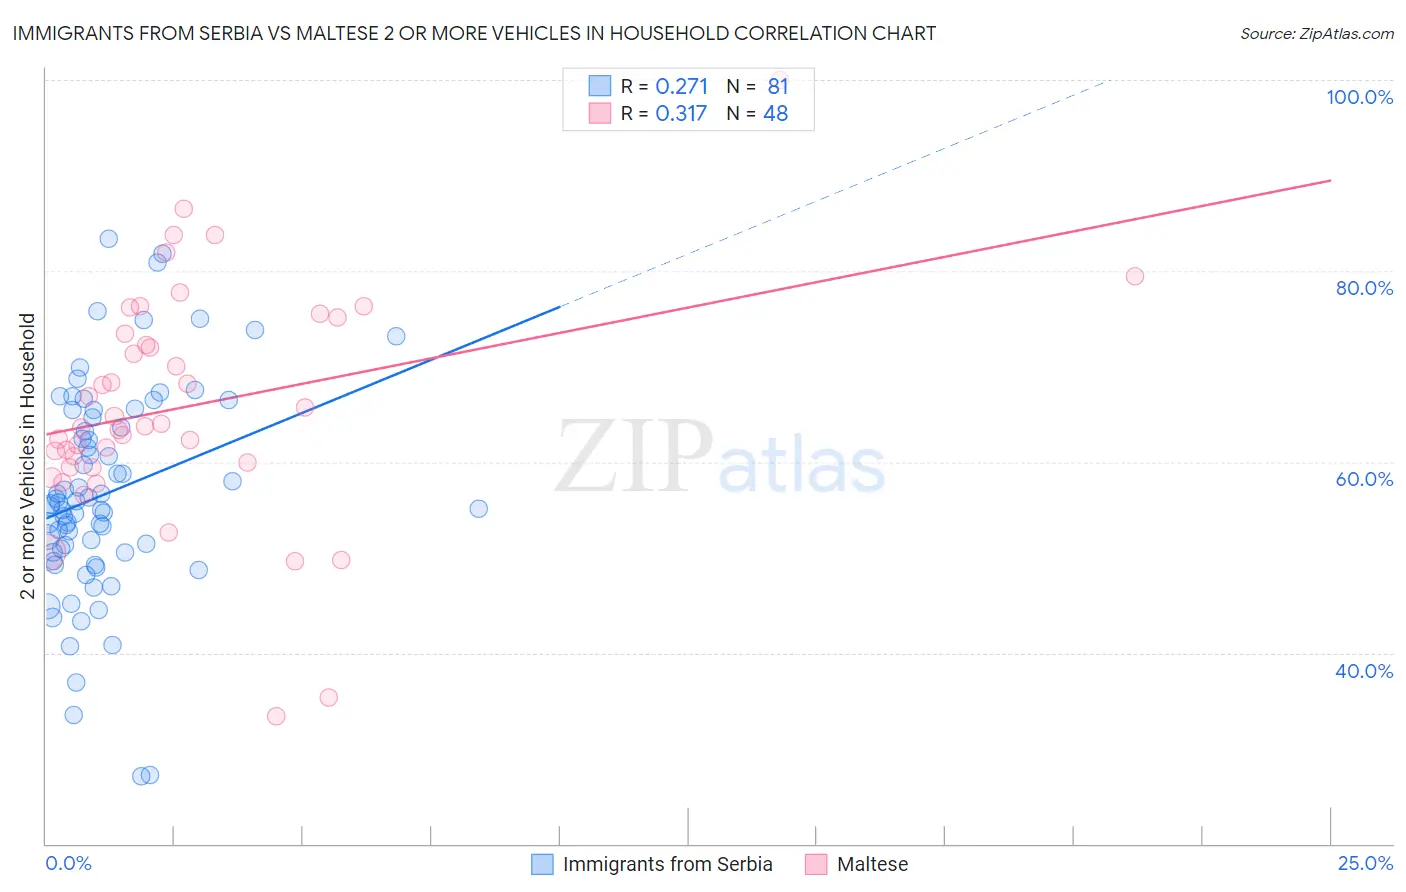
Immigrants from Serbia vs Maltese 2 or more Vehicles in Household Correlation Chart
The statistical analysis conducted on geographies consisting of 131,726,431 people shows a weak positive correlation between the proportion of Immigrants from Serbia and percentage of households with 2 or more vehicles available in the United States with a correlation coefficient (R) of 0.271 and weighted average of 51.3%. Similarly, the statistical analysis conducted on geographies consisting of 126,441,738 people shows a mild positive correlation between the proportion of Maltese and percentage of households with 2 or more vehicles available in the United States with a correlation coefficient (R) of 0.317 and weighted average of 58.0%, a difference of 13.1%.
2 or more Vehicles in Household Correlation Summary
| Measurement | Immigrants from Serbia | Maltese |
| Minimum | 27.0% | 33.3% |
| Maximum | 83.4% | 100.0% |
| Range | 56.4% | 66.7% |
| Mean | 56.7% | 65.9% |
| Median | 55.6% | 63.9% |
| Interquartile 25% (IQ1) | 50.5% | 59.7% |
| Interquartile 75% (IQ3) | 65.0% | 74.3% |
| Interquartile Range (IQR) | 14.5% | 14.6% |
| Standard Deviation (Sample) | 11.1% | 12.2% |
| Standard Deviation (Population) | 11.1% | 12.1% |
Similar Demographics by 2 or more Vehicles in Household
Demographics Similar to Immigrants from Serbia by 2 or more Vehicles in Household
In terms of 2 or more vehicles in household, the demographic groups most similar to Immigrants from Serbia are Immigrants from Liberia (51.3%, a difference of 0.020%), Okinawan (51.2%, a difference of 0.12%), Immigrants from Uruguay (51.4%, a difference of 0.17%), Immigrants from Zaire (51.5%, a difference of 0.33%), and Immigrants from China (51.5%, a difference of 0.37%).
| Demographics | Rating | Rank | 2 or more Vehicles in Household |
| Immigrants | Eastern Europe | 0.1 /100 | #280 | Tragic 51.7% |
| Immigrants | Kazakhstan | 0.1 /100 | #281 | Tragic 51.6% |
| Bahamians | 0.1 /100 | #282 | Tragic 51.5% |
| Immigrants | China | 0.1 /100 | #283 | Tragic 51.5% |
| Immigrants | Zaire | 0.1 /100 | #284 | Tragic 51.5% |
| Immigrants | Uruguay | 0.1 /100 | #285 | Tragic 51.4% |
| Immigrants | Liberia | 0.1 /100 | #286 | Tragic 51.3% |
| Immigrants | Serbia | 0.1 /100 | #287 | Tragic 51.3% |
| Okinawans | 0.1 /100 | #288 | Tragic 51.2% |
| Somalis | 0.0 /100 | #289 | Tragic 51.1% |
| Immigrants | Panama | 0.0 /100 | #290 | Tragic 51.1% |
| Belizeans | 0.0 /100 | #291 | Tragic 51.0% |
| Immigrants | Ukraine | 0.0 /100 | #292 | Tragic 50.9% |
| Blacks/African Americans | 0.0 /100 | #293 | Tragic 50.9% |
| Bermudans | 0.0 /100 | #294 | Tragic 50.6% |
Demographics Similar to Maltese by 2 or more Vehicles in Household
In terms of 2 or more vehicles in household, the demographic groups most similar to Maltese are Icelander (58.0%, a difference of 0.030%), Slovak (58.0%, a difference of 0.050%), Iranian (58.1%, a difference of 0.070%), Potawatomi (58.0%, a difference of 0.080%), and Thai (57.9%, a difference of 0.12%).
| Demographics | Rating | Rank | 2 or more Vehicles in Household |
| Slovenes | 99.5 /100 | #77 | Exceptional 58.3% |
| Lithuanians | 99.5 /100 | #78 | Exceptional 58.2% |
| Delaware | 99.4 /100 | #79 | Exceptional 58.2% |
| Immigrants | England | 99.3 /100 | #80 | Exceptional 58.1% |
| Immigrants | Iraq | 99.3 /100 | #81 | Exceptional 58.1% |
| Iranians | 99.3 /100 | #82 | Exceptional 58.1% |
| Icelanders | 99.2 /100 | #83 | Exceptional 58.0% |
| Maltese | 99.2 /100 | #84 | Exceptional 58.0% |
| Slovaks | 99.2 /100 | #85 | Exceptional 58.0% |
| Potawatomi | 99.1 /100 | #86 | Exceptional 58.0% |
| Thais | 99.1 /100 | #87 | Exceptional 57.9% |
| Immigrants | Iran | 99.1 /100 | #88 | Exceptional 57.9% |
| Immigrants | Germany | 99.0 /100 | #89 | Exceptional 57.9% |
| Hispanics or Latinos | 99.0 /100 | #90 | Exceptional 57.9% |
| Pakistanis | 99.0 /100 | #91 | Exceptional 57.9% |