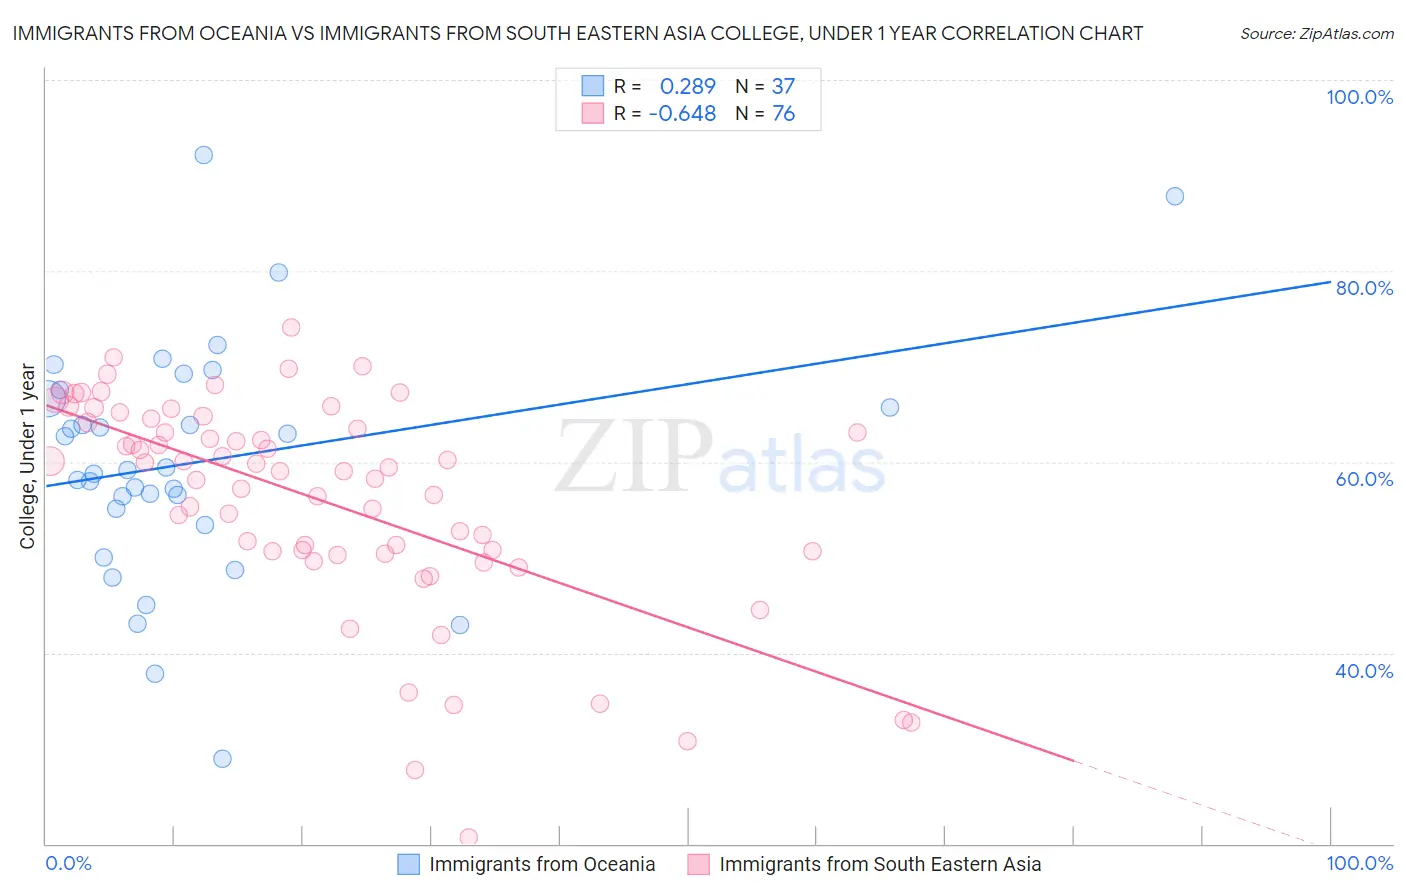
Immigrants from Oceania vs Immigrants from South Eastern Asia College, Under 1 year
COMPARE
Immigrants from Oceania
Immigrants from South Eastern Asia
College, Under 1 year
College, Under 1 year Comparison
Immigrants from Oceania
Immigrants from South Eastern Asia
65.6%
COLLEGE, UNDER 1 YEAR
55.0/ 100
METRIC RATING
171st/ 347
METRIC RANK
64.5%
COLLEGE, UNDER 1 YEAR
22.1/ 100
METRIC RATING
195th/ 347
METRIC RANK
Immigrants from Oceania vs Immigrants from South Eastern Asia College, Under 1 year Correlation Chart
The statistical analysis conducted on geographies consisting of 305,519,500 people shows a weak positive correlation between the proportion of Immigrants from Oceania and percentage of population with at least college, under 1 year education in the United States with a correlation coefficient (R) of 0.289 and weighted average of 65.6%. Similarly, the statistical analysis conducted on geographies consisting of 512,706,379 people shows a significant negative correlation between the proportion of Immigrants from South Eastern Asia and percentage of population with at least college, under 1 year education in the United States with a correlation coefficient (R) of -0.648 and weighted average of 64.5%, a difference of 1.6%.
College, Under 1 year Correlation Summary
| Measurement | Immigrants from Oceania | Immigrants from South Eastern Asia |
| Minimum | 28.9% | 20.7% |
| Maximum | 92.2% | 74.1% |
| Range | 63.2% | 53.4% |
| Mean | 60.1% | 56.1% |
| Median | 59.2% | 59.2% |
| Interquartile 25% (IQ1) | 54.3% | 50.7% |
| Interquartile 75% (IQ3) | 67.1% | 64.3% |
| Interquartile Range (IQR) | 12.8% | 13.7% |
| Standard Deviation (Sample) | 12.6% | 11.2% |
| Standard Deviation (Population) | 12.4% | 11.1% |
Similar Demographics by College, Under 1 year
Demographics Similar to Immigrants from Oceania by College, Under 1 year
In terms of college, under 1 year, the demographic groups most similar to Immigrants from Oceania are Yugoslavian (65.6%, a difference of 0.030%), German (65.6%, a difference of 0.030%), South American Indian (65.5%, a difference of 0.030%), Hungarian (65.6%, a difference of 0.040%), and Swiss (65.5%, a difference of 0.050%).
| Demographics | Rating | Rank | College, Under 1 year |
| Czechoslovakians | 62.6 /100 | #164 | Good 65.8% |
| Immigrants | Uzbekistan | 61.6 /100 | #165 | Good 65.8% |
| Moroccans | 56.7 /100 | #166 | Average 65.6% |
| Immigrants | Somalia | 56.4 /100 | #167 | Average 65.6% |
| Hungarians | 55.9 /100 | #168 | Average 65.6% |
| Yugoslavians | 55.7 /100 | #169 | Average 65.6% |
| Germans | 55.7 /100 | #170 | Average 65.6% |
| Immigrants | Oceania | 55.0 /100 | #171 | Average 65.6% |
| South American Indians | 54.4 /100 | #172 | Average 65.5% |
| Swiss | 53.9 /100 | #173 | Average 65.5% |
| Immigrants | Bosnia and Herzegovina | 50.0 /100 | #174 | Average 65.4% |
| Scotch-Irish | 49.5 /100 | #175 | Average 65.4% |
| French | 48.9 /100 | #176 | Average 65.4% |
| Immigrants | North Macedonia | 48.6 /100 | #177 | Average 65.4% |
| German Russians | 48.3 /100 | #178 | Average 65.4% |
Demographics Similar to Immigrants from South Eastern Asia by College, Under 1 year
In terms of college, under 1 year, the demographic groups most similar to Immigrants from South Eastern Asia are Tongan (64.5%, a difference of 0.050%), Immigrants from Cameroon (64.6%, a difference of 0.16%), Costa Rican (64.4%, a difference of 0.17%), Slovak (64.7%, a difference of 0.28%), and Immigrants from Thailand (64.7%, a difference of 0.30%).
| Demographics | Rating | Rank | College, Under 1 year |
| Immigrants | Albania | 32.0 /100 | #188 | Fair 64.9% |
| Spanish | 31.6 /100 | #189 | Fair 64.9% |
| Immigrants | Philippines | 30.1 /100 | #190 | Fair 64.8% |
| Immigrants | Armenia | 28.1 /100 | #191 | Fair 64.7% |
| Immigrants | Thailand | 27.0 /100 | #192 | Fair 64.7% |
| Slovaks | 26.7 /100 | #193 | Fair 64.7% |
| Immigrants | Cameroon | 24.6 /100 | #194 | Fair 64.6% |
| Immigrants | South Eastern Asia | 22.1 /100 | #195 | Fair 64.5% |
| Tongans | 21.2 /100 | #196 | Fair 64.5% |
| Costa Ricans | 19.6 /100 | #197 | Poor 64.4% |
| Tsimshian | 17.9 /100 | #198 | Poor 64.3% |
| Panamanians | 17.0 /100 | #199 | Poor 64.3% |
| Nigerians | 16.7 /100 | #200 | Poor 64.3% |
| French Canadians | 16.3 /100 | #201 | Poor 64.2% |
| South Americans | 16.2 /100 | #202 | Poor 64.2% |