Immigrants from Norway vs Immigrants from Burma/Myanmar 4 or more Vehicles in Household
COMPARE
Immigrants from Norway
Immigrants from Burma/Myanmar
4 or more Vehicles in Household
4 or more Vehicles in Household Comparison
Immigrants from Norway
Immigrants from Burma/Myanmar
6.1%
4 OR MORE VEHICLES IN HOUSEHOLD
21.8/ 100
METRIC RATING
199th/ 347
METRIC RANK
6.2%
4 OR MORE VEHICLES IN HOUSEHOLD
37.5/ 100
METRIC RATING
183rd/ 347
METRIC RANK
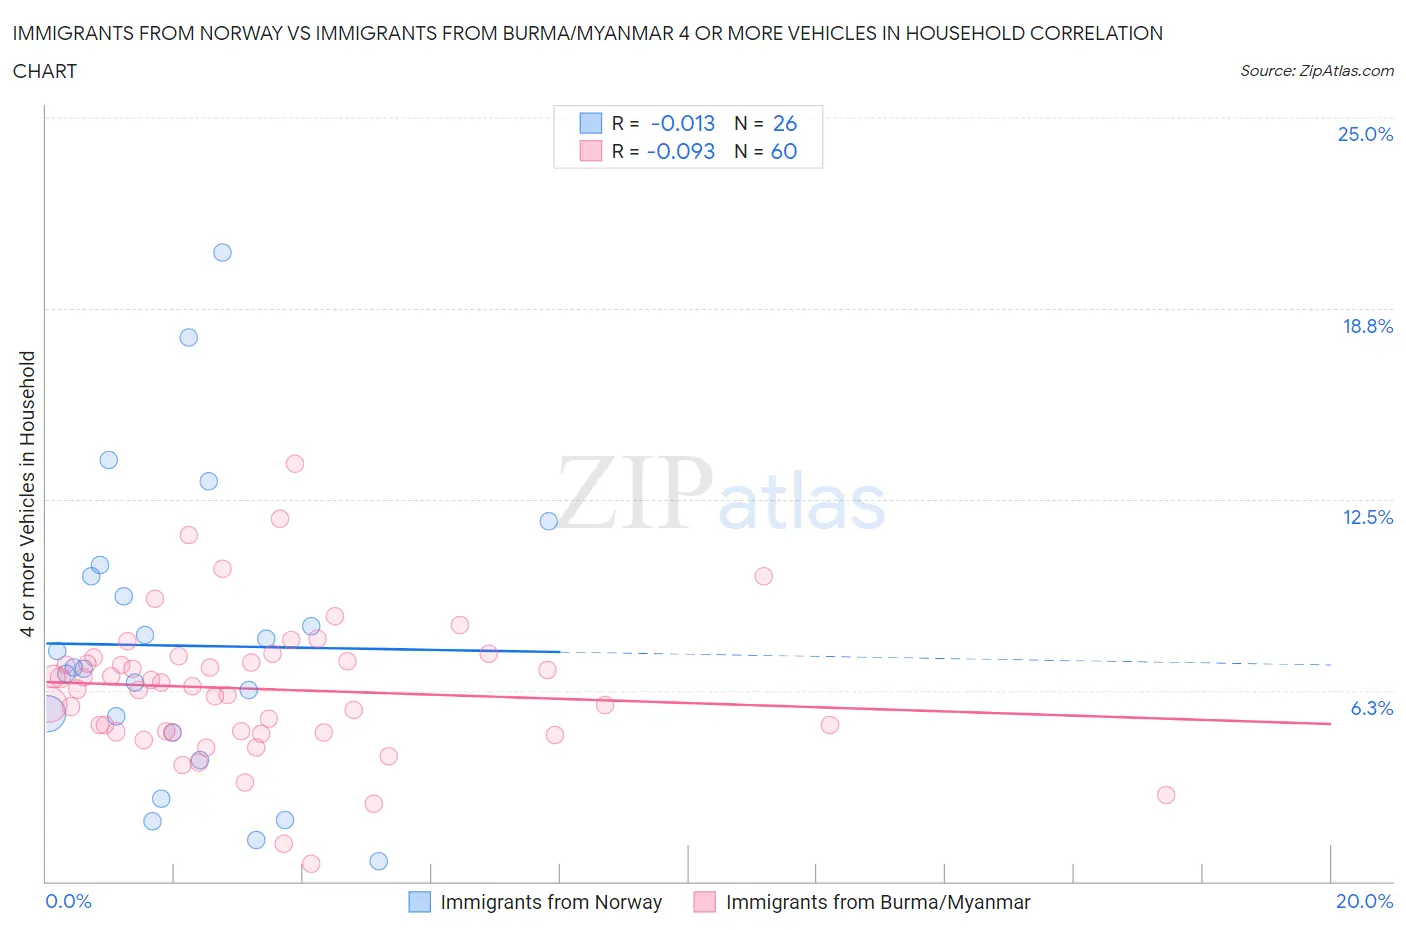
Immigrants from Norway vs Immigrants from Burma/Myanmar 4 or more Vehicles in Household Correlation Chart
The statistical analysis conducted on geographies consisting of 116,239,195 people shows no correlation between the proportion of Immigrants from Norway and percentage of households with 4 or more vehicles available in the United States with a correlation coefficient (R) of -0.013 and weighted average of 6.1%. Similarly, the statistical analysis conducted on geographies consisting of 171,874,303 people shows a slight negative correlation between the proportion of Immigrants from Burma/Myanmar and percentage of households with 4 or more vehicles available in the United States with a correlation coefficient (R) of -0.093 and weighted average of 6.2%, a difference of 2.0%.
4 or more Vehicles in Household Correlation Summary
| Measurement | Immigrants from Norway | Immigrants from Burma/Myanmar |
| Minimum | 0.66% | 0.59% |
| Maximum | 20.6% | 13.7% |
| Range | 19.9% | 13.1% |
| Mean | 7.7% | 6.3% |
| Median | 7.0% | 6.3% |
| Interquartile 25% (IQ1) | 4.9% | 4.9% |
| Interquartile 75% (IQ3) | 10.0% | 7.3% |
| Interquartile Range (IQR) | 5.1% | 2.4% |
| Standard Deviation (Sample) | 4.8% | 2.3% |
| Standard Deviation (Population) | 4.7% | 2.3% |
Demographics Similar to Immigrants from Norway and Immigrants from Burma/Myanmar by 4 or more Vehicles in Household
In terms of 4 or more vehicles in household, the demographic groups most similar to Immigrants from Norway are Latvian (6.1%, a difference of 0.0%), Egyptian (6.1%, a difference of 0.060%), Immigrants from Portugal (6.1%, a difference of 0.080%), Immigrants from Sri Lanka (6.1%, a difference of 0.29%), and Tsimshian (6.2%, a difference of 0.67%). Similarly, the demographic groups most similar to Immigrants from Burma/Myanmar are Iraqi (6.2%, a difference of 0.020%), Thai (6.2%, a difference of 0.060%), Immigrants from Northern Europe (6.2%, a difference of 0.080%), Immigrants from South Africa (6.2%, a difference of 0.23%), and Kiowa (6.2%, a difference of 0.31%).
| Demographics | Rating | Rank | 4 or more Vehicles in Household |
| Yugoslavians | 41.1 /100 | #181 | Average 6.3% |
| South American Indians | 40.7 /100 | #182 | Average 6.3% |
| Immigrants | Burma/Myanmar | 37.5 /100 | #183 | Fair 6.2% |
| Iraqis | 37.3 /100 | #184 | Fair 6.2% |
| Thais | 36.9 /100 | #185 | Fair 6.2% |
| Immigrants | Northern Europe | 36.8 /100 | #186 | Fair 6.2% |
| Immigrants | South Africa | 35.4 /100 | #187 | Fair 6.2% |
| Kiowa | 34.7 /100 | #188 | Fair 6.2% |
| Immigrants | Eastern Asia | 33.3 /100 | #189 | Fair 6.2% |
| South Africans | 32.2 /100 | #190 | Fair 6.2% |
| Inupiat | 30.7 /100 | #191 | Fair 6.2% |
| Romanians | 30.7 /100 | #192 | Fair 6.2% |
| Immigrants | Kuwait | 28.0 /100 | #193 | Fair 6.2% |
| Immigrants | Sweden | 27.0 /100 | #194 | Fair 6.2% |
| Argentineans | 27.0 /100 | #195 | Fair 6.2% |
| Tsimshian | 26.4 /100 | #196 | Fair 6.2% |
| Immigrants | Sri Lanka | 23.7 /100 | #197 | Fair 6.1% |
| Immigrants | Portugal | 22.3 /100 | #198 | Fair 6.1% |
| Immigrants | Norway | 21.8 /100 | #199 | Fair 6.1% |
| Latvians | 21.7 /100 | #200 | Fair 6.1% |
| Egyptians | 21.4 /100 | #201 | Fair 6.1% |