French vs Immigrants from Burma/Myanmar 4 or more Vehicles in Household

COMPARE

French
Race
Ancestry
AfghanAfricanAlaska NativeAlaskan AthabascanAlbanianAleutAlsatianAmericanApacheArabArapahoArgentineanArmenianAssyrian/Chaldean/SyriacAustralianAustrianBahamianBangladeshiBarbadianBasqueBelgianBelizeanBermudanBhutaneseBlackfeetBolivianBrazilianBritishBritish West IndianBulgarianBurmeseCajunCambodianCanadianCape VerdeanCarpatho RusynCelticCentral AmericanCentral American IndianCherokeeCheyenneChickasawChileanChineseChippewaChoctawColombianColvilleComancheCosta RicanCreeCreekCroatianCrowCubanCypriotCzechCzechoslovakianDanishDelawareDominicanDutchDutch West IndianEastern EuropeanEcuadorianEgyptianEnglishEstonianEthiopianEuropeanFijianFilipinoFinnishFrenchFrench American IndianFrench CanadianGermanGerman RussianGhanaianGreekGuamanian/ChamorroGuatemalanGuyaneseHaitianHmongHonduranHopiHoumaHungarianIcelanderIndian (Asian)IndonesianInupiatIranianIraqiIrishIroquoisIsraeliItalianJamaicanJapaneseJordanianKenyanKiowaKoreanLaotianLatvianLebaneseLiberianLithuanianLumbeeLuxembourgerMacedonianMalaysianMalteseMarshalleseMenomineeMexicanMexican American IndianMongolianMoroccanNative HawaiianNavajoNepaleseNew ZealanderNicaraguanNigerianNorthern EuropeanNorwegianOkinawanOsageOttawaPaiutePakistaniPalestinianPanamanianParaguayanPennsylvania GermanPeruvianPimaPolishPortuguesePotawatomiPuebloPuerto RicanPuget Sound SalishRomanianRussianSalvadoranSamoanScandinavianScotch-IrishScottishSeminoleSenegaleseSerbianShoshoneSierra LeoneanSiouxSlavicSlovakSloveneSomaliSouth AfricanSouth AmericanSouth American IndianSoviet UnionSpaniardSpanishSpanish AmericanSpanish American IndianSri LankanSubsaharan AfricanSudaneseSwedishSwissSyrianTaiwaneseThaiTlingit-HaidaTohono O'OdhamTonganTrinidadian and TobagonianTsimshianTurkishU.S. Virgin IslanderUgandanUkrainianUruguayanUteVenezuelanVietnameseWelshWest IndianYakamaYaquiYugoslavianYumanYup'ikZimbabwean
Immigration
NonimmigrantsImmigrantsAfghanistanAfricaAlbaniaArgentinaArmeniaAsiaAustraliaAustriaBahamasBangladeshBarbadosBelarusBelgiumBelizeBoliviaBosnia and HerzegovinaBrazilBulgariaCabo VerdeCambodiaCameroonCanadaCaribbeanCentral AmericaChileChinaColombiaCongoCosta RicaCroatiaCubaCzechoslovakiaDenmarkDominicaDominican RepublicEastern AfricaEastern AsiaEastern EuropeEcuadorEgyptEl SalvadorEnglandEritreaEthiopiaEuropeFijiFranceGermanyGhanaGreeceGrenadaGuatemalaGuyanaHaitiHondurasHong KongHungaryIndiaIndonesiaIranIraqIrelandIsraelItalyJamaicaJapanJordanKazakhstanKenyaKoreaKuwaitLaosLatin AmericaLatviaLebanonLiberiaLithuaniaMalaysiaMexicoMicronesiaMiddle AfricaMoldovaMoroccoNepalNetherlandsNicaraguaNigeriaNorth AmericaNorth MacedoniaNorthern AfricaNorthern EuropeNorwayOceaniaPakistanPanamaPeruPhilippinesPolandPortugalRomaniaRussiaSaudi ArabiaScotlandSenegalSerbiaSierra LeoneSingaporeSomaliaSouth AfricaSouth AmericaSouth Central AsiaSouth Eastern AsiaSouthern EuropeSpainSri LankaSt. Vincent and the GrenadinesSudanSwedenSwitzerlandSyriaTaiwanThailandTrinidad and TobagoTurkeyUgandaUkraineUruguayUzbekistanVenezuelaVietnamWest IndiesWestern AfricaWestern AsiaWestern EuropeYemenZaireZimbabweAzores
Immigrants from Burma/Myanmar
Race
Ancestry
AfghanAfricanAlaska NativeAlaskan AthabascanAlbanianAleutAlsatianAmericanApacheArabArapahoArgentineanArmenianAssyrian/Chaldean/SyriacAustralianAustrianBahamianBangladeshiBarbadianBasqueBelgianBelizeanBermudanBhutaneseBlackfeetBolivianBrazilianBritishBritish West IndianBulgarianBurmeseCajunCambodianCanadianCape VerdeanCarpatho RusynCelticCentral AmericanCentral American IndianCherokeeCheyenneChickasawChileanChineseChippewaChoctawColombianColvilleComancheCosta RicanCreeCreekCroatianCrowCubanCypriotCzechCzechoslovakianDanishDelawareDominicanDutchDutch West IndianEastern EuropeanEcuadorianEgyptianEnglishEstonianEthiopianEuropeanFijianFilipinoFinnishFrench American IndianFrench CanadianGermanGerman RussianGhanaianGreekGuamanian/ChamorroGuatemalanGuyaneseHaitianHmongHonduranHopiHoumaHungarianIcelanderIndian (Asian)IndonesianInupiatIranianIraqiIrishIroquoisIsraeliItalianJamaicanJapaneseJordanianKenyanKiowaKoreanLaotianLatvianLebaneseLiberianLithuanianLumbeeLuxembourgerMacedonianMalaysianMalteseMarshalleseMenomineeMexicanMexican American IndianMongolianMoroccanNative HawaiianNavajoNepaleseNew ZealanderNicaraguanNigerianNorthern EuropeanNorwegianOkinawanOsageOttawaPaiutePakistaniPalestinianPanamanianParaguayanPennsylvania GermanPeruvianPimaPolishPortuguesePotawatomiPuebloPuerto RicanPuget Sound SalishRomanianRussianSalvadoranSamoanScandinavianScotch-IrishScottishSeminoleSenegaleseSerbianShoshoneSierra LeoneanSiouxSlavicSlovakSloveneSomaliSouth AfricanSouth AmericanSouth American IndianSoviet UnionSpaniardSpanishSpanish AmericanSpanish American IndianSri LankanSubsaharan AfricanSudaneseSwedishSwissSyrianTaiwaneseThaiTlingit-HaidaTohono O'OdhamTonganTrinidadian and TobagonianTsimshianTurkishU.S. Virgin IslanderUgandanUkrainianUruguayanUteVenezuelanVietnameseWelshWest IndianYakamaYaquiYugoslavianYumanYup'ikZimbabwean
Immigration
NonimmigrantsImmigrantsAfghanistanAfricaAlbaniaArgentinaArmeniaAsiaAustraliaAustriaBahamasBangladeshBarbadosBelarusBelgiumBelizeBoliviaBosnia and HerzegovinaBrazilBulgariaBurma/MyanmarCabo VerdeCambodiaCameroonCanadaCaribbeanCentral AmericaChileChinaColombiaCongoCosta RicaCroatiaCubaCzechoslovakiaDenmarkDominicaDominican RepublicEastern AfricaEastern AsiaEastern EuropeEcuadorEgyptEl SalvadorEnglandEritreaEthiopiaEuropeFijiFranceGermanyGhanaGreeceGrenadaGuatemalaGuyanaHaitiHondurasHong KongHungaryIndiaIndonesiaIranIraqIrelandIsraelItalyJamaicaJapanJordanKazakhstanKenyaKoreaKuwaitLaosLatin AmericaLatviaLebanonLiberiaLithuaniaMalaysiaMexicoMicronesiaMiddle AfricaMoldovaMoroccoNepalNetherlandsNicaraguaNigeriaNorth AmericaNorth MacedoniaNorthern AfricaNorthern EuropeNorwayOceaniaPakistanPanamaPeruPhilippinesPolandPortugalRomaniaRussiaSaudi ArabiaScotlandSenegalSerbiaSierra LeoneSingaporeSomaliaSouth AfricaSouth AmericaSouth Central AsiaSouth Eastern AsiaSouthern EuropeSpainSri LankaSt. Vincent and the GrenadinesSudanSwedenSwitzerlandSyriaTaiwanThailandTrinidad and TobagoTurkeyUgandaUkraineUruguayUzbekistanVenezuelaVietnamWest IndiesWestern AfricaWestern AsiaWestern EuropeYemenZaireZimbabweAzores
4 or more Vehicles in Household
Income
Poverty
Unemployment
Labor Participation
Family Structure
Vehicle Availability
Education Level
Disability

4 or more Vehicles in Household Comparison

French

Immigrants from Burma/Myanmar

Exceptional
Fair
6.9%
4 OR MORE VEHICLES IN HOUSEHOLD
97.7/ 100
METRIC RATING
108th/ 347
METRIC RANK
6.2%
4 OR MORE VEHICLES IN HOUSEHOLD
37.5/ 100
METRIC RATING
183rd/ 347
METRIC RANK

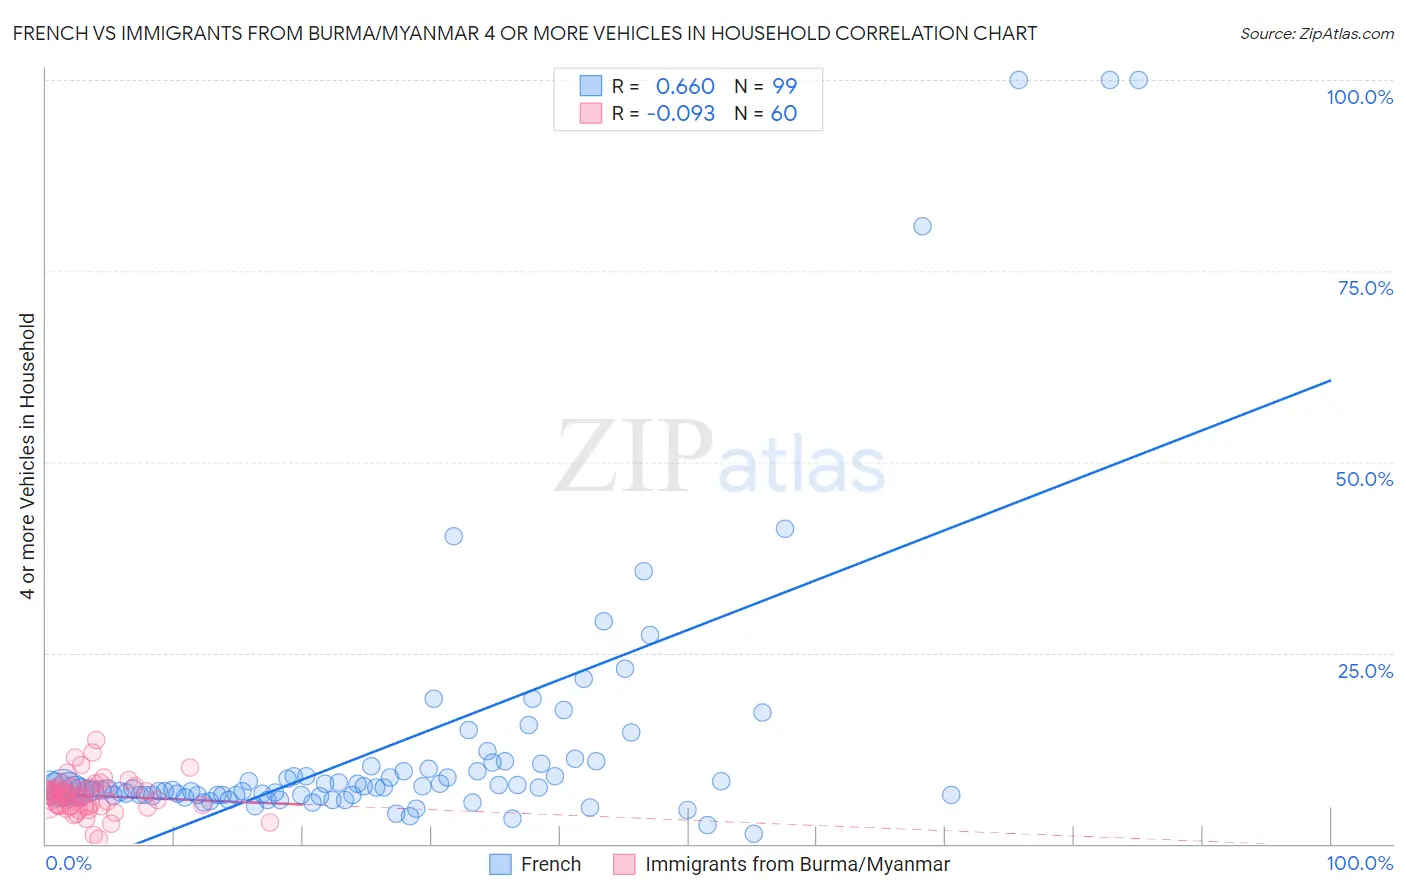
French vs Immigrants from Burma/Myanmar 4 or more Vehicles in Household Correlation Chart

The statistical analysis conducted on geographies consisting of 568,874,397 people shows a significant positive correlation between the proportion of French and percentage of households with 4 or more vehicles available in the United States with a correlation coefficient (R) of 0.660 and weighted average of 6.9%. Similarly, the statistical analysis conducted on geographies consisting of 171,874,303 people shows a slight negative correlation between the proportion of Immigrants from Burma/Myanmar and percentage of households with 4 or more vehicles available in the United States with a correlation coefficient (R) of -0.093 and weighted average of 6.2%, a difference of 11.0%.
French vs Immigrants from Burma/Myanmar 4 or more Vehicles in Household

4 or more Vehicles in Household Correlation Summary

MeasurementFrenchImmigrants from Burma/Myanmar
Minimum1.3%0.59%
Maximum100.0%13.7%
Range98.7%13.1%
Mean13.0%6.3%
Median7.2%6.3%
Interquartile 25% (IQ1)6.4%4.9%
Interquartile 75% (IQ3)10.2%7.3%
Interquartile Range (IQR)3.8%2.4%
Standard Deviation (Sample)18.4%2.3%
Standard Deviation (Population)18.3%2.3%

Similar Demographics by 4 or more Vehicles in Household

Demographics Similar to French by 4 or more Vehicles in Household

In terms of 4 or more vehicles in household, the demographic groups most similar to French are Filipino (6.9%, a difference of 0.18%), Nicaraguan (7.0%, a difference of 0.34%), Guatemalan (7.0%, a difference of 0.35%), German Russian (7.0%, a difference of 0.69%), and Immigrants from Thailand (6.9%, a difference of 0.69%).
DemographicsRating | Rank4 or more Vehicles in Household
Pakistanis
98.7
/100
|
#101
Exceptional
7.0%
Asians
98.6
/100
|
#102
Exceptional
7.0%
Blackfeet
98.6
/100
|
#103
Exceptional
7.0%
Hmong
98.3
/100
|
#104
Exceptional
7.0%
German Russians
98.3
/100
|
#105
Exceptional
7.0%
Guatemalans
98.1
/100
|
#106
Exceptional
7.0%
Nicaraguans
98.0
/100
|
#107
Exceptional
7.0%
French
97.7
/100
|
#108
Exceptional
6.9%
Filipinos
97.6
/100
|
#109
Exceptional
6.9%
Immigrants | Thailand
97.0
/100
|
#110
Exceptional
6.9%
Aleuts
97.0
/100
|
#111
Exceptional
6.9%
Hopi
97.0
/100
|
#112
Exceptional
6.9%
Canadians
96.4
/100
|
#113
Exceptional
6.9%
Bolivians
96.3
/100
|
#114
Exceptional
6.8%
Tlingit-Haida
96.2
/100
|
#115
Exceptional
6.8%

Demographics Similar to Immigrants from Burma/Myanmar by 4 or more Vehicles in Household

In terms of 4 or more vehicles in household, the demographic groups most similar to Immigrants from Burma/Myanmar are Iraqi (6.2%, a difference of 0.020%), Thai (6.2%, a difference of 0.060%), Immigrants from Northern Europe (6.2%, a difference of 0.080%), Immigrants from South Africa (6.2%, a difference of 0.23%), and Kiowa (6.2%, a difference of 0.31%).
DemographicsRating | Rank4 or more Vehicles in Household
Ukrainians
47.6
/100
|
#176
Average
6.3%
Slovaks
46.9
/100
|
#177
Average
6.3%
Belizeans
44.5
/100
|
#178
Average
6.3%
Immigrants | Japan
43.1
/100
|
#179
Average
6.3%
Syrians
42.0
/100
|
#180
Average
6.3%
Yugoslavians
41.1
/100
|
#181
Average
6.3%
South American Indians
40.7
/100
|
#182
Average
6.3%
Immigrants | Burma/Myanmar
37.5
/100
|
#183
Fair
6.2%
Iraqis
37.3
/100
|
#184
Fair
6.2%
Thais
36.9
/100
|
#185
Fair
6.2%
Immigrants | Northern Europe
36.8
/100
|
#186
Fair
6.2%
Immigrants | South Africa
35.4
/100
|
#187
Fair
6.2%
Kiowa
34.7
/100
|
#188
Fair
6.2%
Immigrants | Eastern Asia
33.3
/100
|
#189
Fair
6.2%
South Africans
32.2
/100
|
#190
Fair
6.2%