Immigrants from Norway vs Guyanese 4 or more Vehicles in Household
COMPARE
Immigrants from Norway
Guyanese
4 or more Vehicles in Household
4 or more Vehicles in Household Comparison
Immigrants from Norway
Guyanese
6.1%
4 OR MORE VEHICLES IN HOUSEHOLD
21.8/ 100
METRIC RATING
199th/ 347
METRIC RANK
3.5%
4 OR MORE VEHICLES IN HOUSEHOLD
0.0/ 100
METRIC RATING
342nd/ 347
METRIC RANK
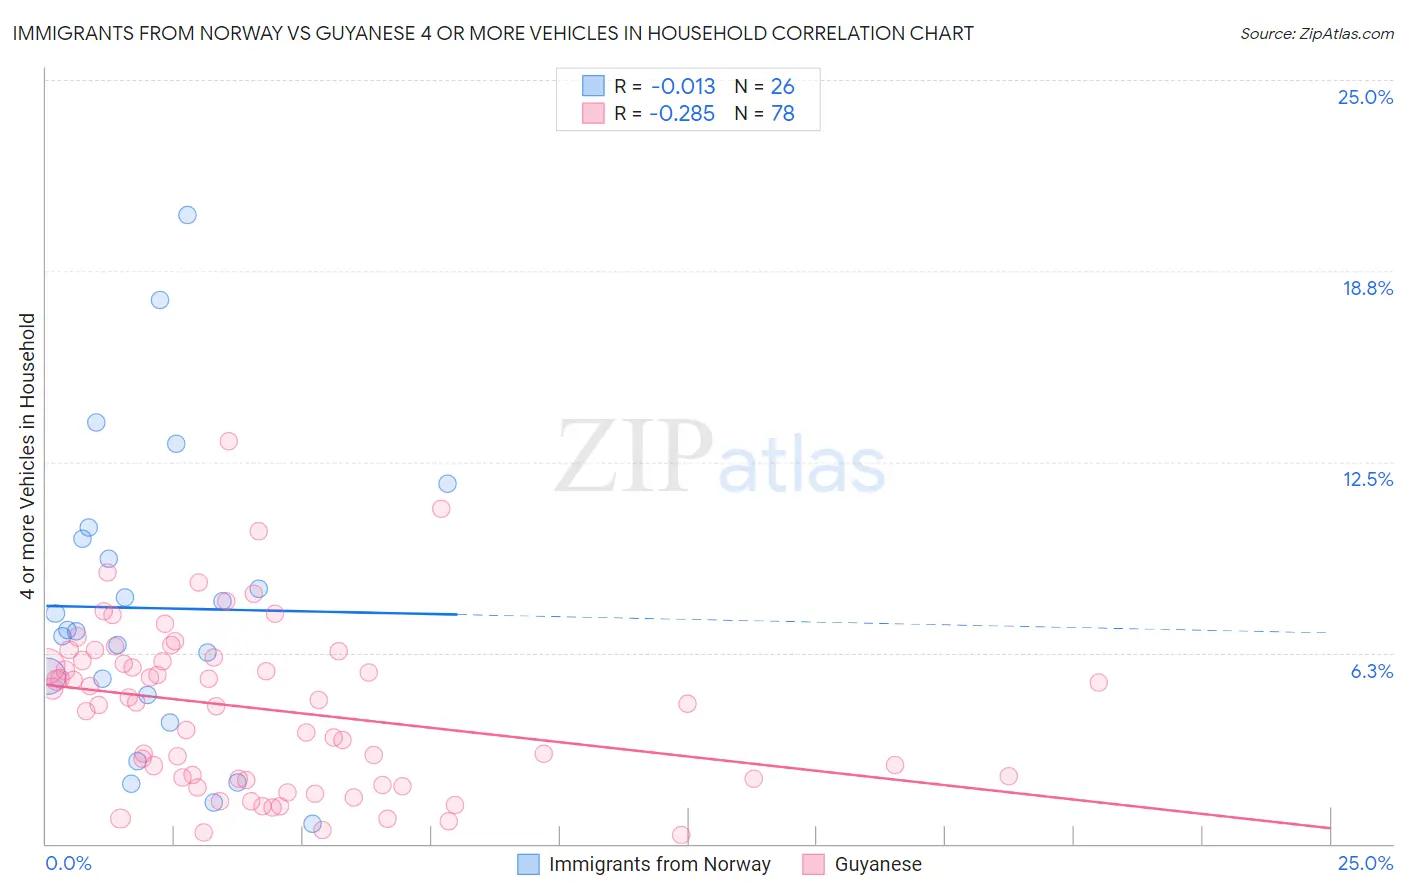
Immigrants from Norway vs Guyanese 4 or more Vehicles in Household Correlation Chart
The statistical analysis conducted on geographies consisting of 116,239,195 people shows no correlation between the proportion of Immigrants from Norway and percentage of households with 4 or more vehicles available in the United States with a correlation coefficient (R) of -0.013 and weighted average of 6.1%. Similarly, the statistical analysis conducted on geographies consisting of 175,655,859 people shows a weak negative correlation between the proportion of Guyanese and percentage of households with 4 or more vehicles available in the United States with a correlation coefficient (R) of -0.285 and weighted average of 3.5%, a difference of 75.6%.
4 or more Vehicles in Household Correlation Summary
| Measurement | Immigrants from Norway | Guyanese |
| Minimum | 0.66% | 0.29% |
| Maximum | 20.6% | 13.2% |
| Range | 19.9% | 12.9% |
| Mean | 7.7% | 4.4% |
| Median | 7.0% | 4.6% |
| Interquartile 25% (IQ1) | 4.9% | 2.1% |
| Interquartile 75% (IQ3) | 10.0% | 6.0% |
| Interquartile Range (IQR) | 5.1% | 3.9% |
| Standard Deviation (Sample) | 4.8% | 2.7% |
| Standard Deviation (Population) | 4.7% | 2.7% |
Similar Demographics by 4 or more Vehicles in Household
Demographics Similar to Immigrants from Norway by 4 or more Vehicles in Household
In terms of 4 or more vehicles in household, the demographic groups most similar to Immigrants from Norway are Latvian (6.1%, a difference of 0.0%), Egyptian (6.1%, a difference of 0.060%), Immigrants from South Central Asia (6.1%, a difference of 0.070%), Immigrants from Portugal (6.1%, a difference of 0.080%), and Immigrants from Sierra Leone (6.1%, a difference of 0.20%).
| Demographics | Rating | Rank | 4 or more Vehicles in Household |
| Romanians | 30.7 /100 | #192 | Fair 6.2% |
| Immigrants | Kuwait | 28.0 /100 | #193 | Fair 6.2% |
| Immigrants | Sweden | 27.0 /100 | #194 | Fair 6.2% |
| Argentineans | 27.0 /100 | #195 | Fair 6.2% |
| Tsimshian | 26.4 /100 | #196 | Fair 6.2% |
| Immigrants | Sri Lanka | 23.7 /100 | #197 | Fair 6.1% |
| Immigrants | Portugal | 22.3 /100 | #198 | Fair 6.1% |
| Immigrants | Norway | 21.8 /100 | #199 | Fair 6.1% |
| Latvians | 21.7 /100 | #200 | Fair 6.1% |
| Egyptians | 21.4 /100 | #201 | Fair 6.1% |
| Immigrants | South Central Asia | 21.3 /100 | #202 | Fair 6.1% |
| Immigrants | Sierra Leone | 20.5 /100 | #203 | Fair 6.1% |
| Immigrants | Belize | 19.8 /100 | #204 | Poor 6.1% |
| Hondurans | 19.3 /100 | #205 | Poor 6.1% |
| Kenyans | 18.5 /100 | #206 | Poor 6.1% |
Demographics Similar to Guyanese by 4 or more Vehicles in Household
In terms of 4 or more vehicles in household, the demographic groups most similar to Guyanese are Dominican (3.5%, a difference of 0.69%), British West Indian (3.5%, a difference of 0.94%), Immigrants from Guyana (3.4%, a difference of 2.6%), Immigrants from Barbados (3.6%, a difference of 3.5%), and Immigrants from Uzbekistan (3.6%, a difference of 4.1%).
| Demographics | Rating | Rank | 4 or more Vehicles in Household |
| Immigrants | Albania | 0.0 /100 | #333 | Tragic 4.1% |
| Immigrants | Trinidad and Tobago | 0.0 /100 | #334 | Tragic 4.1% |
| Barbadians | 0.0 /100 | #335 | Tragic 3.9% |
| Immigrants | Bangladesh | 0.0 /100 | #336 | Tragic 3.9% |
| Vietnamese | 0.0 /100 | #337 | Tragic 3.9% |
| Immigrants | Cabo Verde | 0.0 /100 | #338 | Tragic 3.8% |
| Immigrants | Uzbekistan | 0.0 /100 | #339 | Tragic 3.6% |
| Immigrants | Barbados | 0.0 /100 | #340 | Tragic 3.6% |
| Dominicans | 0.0 /100 | #341 | Tragic 3.5% |
| Guyanese | 0.0 /100 | #342 | Tragic 3.5% |
| British West Indians | 0.0 /100 | #343 | Tragic 3.5% |
| Immigrants | Guyana | 0.0 /100 | #344 | Tragic 3.4% |
| Immigrants | Dominican Republic | 0.0 /100 | #345 | Tragic 3.3% |
| Immigrants | St. Vincent and the Grenadines | 0.0 /100 | #346 | Tragic 3.0% |
| Immigrants | Grenada | 0.0 /100 | #347 | Tragic 2.7% |