Immigrants from Czechoslovakia vs Immigrants from Burma/Myanmar 4 or more Vehicles in Household
COMPARE
Immigrants from Czechoslovakia
Immigrants from Burma/Myanmar
4 or more Vehicles in Household
4 or more Vehicles in Household Comparison
Immigrants from Czechoslovakia
Immigrants from Burma/Myanmar
5.8%
4 OR MORE VEHICLES IN HOUSEHOLD
3.2/ 100
METRIC RATING
243rd/ 347
METRIC RANK
6.2%
4 OR MORE VEHICLES IN HOUSEHOLD
37.5/ 100
METRIC RATING
183rd/ 347
METRIC RANK
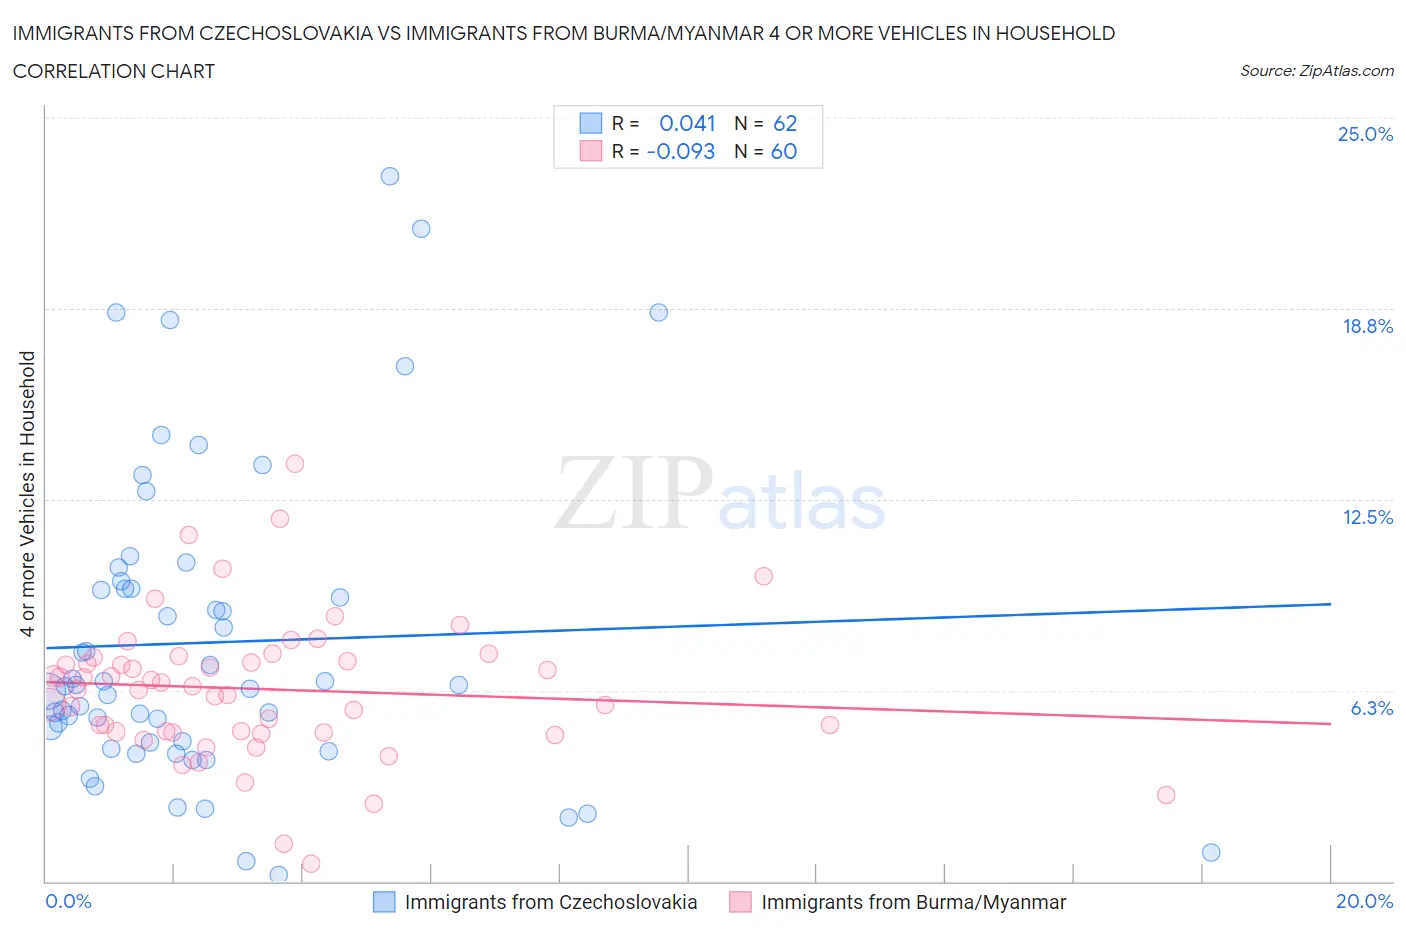
Immigrants from Czechoslovakia vs Immigrants from Burma/Myanmar 4 or more Vehicles in Household Correlation Chart
The statistical analysis conducted on geographies consisting of 194,652,046 people shows no correlation between the proportion of Immigrants from Czechoslovakia and percentage of households with 4 or more vehicles available in the United States with a correlation coefficient (R) of 0.041 and weighted average of 5.8%. Similarly, the statistical analysis conducted on geographies consisting of 171,874,303 people shows a slight negative correlation between the proportion of Immigrants from Burma/Myanmar and percentage of households with 4 or more vehicles available in the United States with a correlation coefficient (R) of -0.093 and weighted average of 6.2%, a difference of 8.0%.
4 or more Vehicles in Household Correlation Summary
| Measurement | Immigrants from Czechoslovakia | Immigrants from Burma/Myanmar |
| Minimum | 0.19% | 0.59% |
| Maximum | 23.1% | 13.7% |
| Range | 22.9% | 13.1% |
| Mean | 7.8% | 6.3% |
| Median | 6.4% | 6.3% |
| Interquartile 25% (IQ1) | 4.5% | 4.9% |
| Interquartile 75% (IQ3) | 9.6% | 7.3% |
| Interquartile Range (IQR) | 5.1% | 2.4% |
| Standard Deviation (Sample) | 5.1% | 2.3% |
| Standard Deviation (Population) | 5.0% | 2.3% |
Similar Demographics by 4 or more Vehicles in Household
Demographics Similar to Immigrants from Czechoslovakia by 4 or more Vehicles in Household
In terms of 4 or more vehicles in household, the demographic groups most similar to Immigrants from Czechoslovakia are Ethiopian (5.8%, a difference of 0.010%), Bulgarian (5.8%, a difference of 0.050%), Immigrants from Middle Africa (5.8%, a difference of 0.19%), Mongolian (5.8%, a difference of 0.40%), and Immigrants from Poland (5.8%, a difference of 0.49%).
| Demographics | Rating | Rank | 4 or more Vehicles in Household |
| Immigrants | Eritrea | 4.5 /100 | #236 | Tragic 5.8% |
| Turks | 4.1 /100 | #237 | Tragic 5.8% |
| Immigrants | Belgium | 4.0 /100 | #238 | Tragic 5.8% |
| Immigrants | Australia | 3.8 /100 | #239 | Tragic 5.8% |
| Immigrants | Poland | 3.8 /100 | #240 | Tragic 5.8% |
| Mongolians | 3.7 /100 | #241 | Tragic 5.8% |
| Immigrants | Middle Africa | 3.4 /100 | #242 | Tragic 5.8% |
| Immigrants | Czechoslovakia | 3.2 /100 | #243 | Tragic 5.8% |
| Ethiopians | 3.2 /100 | #244 | Tragic 5.8% |
| Bulgarians | 3.1 /100 | #245 | Tragic 5.8% |
| Immigrants | North Macedonia | 2.5 /100 | #246 | Tragic 5.7% |
| Immigrants | Ethiopia | 2.4 /100 | #247 | Tragic 5.7% |
| Immigrants | Eastern Africa | 2.4 /100 | #248 | Tragic 5.7% |
| Immigrants | Southern Europe | 2.3 /100 | #249 | Tragic 5.7% |
| Immigrants | Europe | 2.3 /100 | #250 | Tragic 5.7% |
Demographics Similar to Immigrants from Burma/Myanmar by 4 or more Vehicles in Household
In terms of 4 or more vehicles in household, the demographic groups most similar to Immigrants from Burma/Myanmar are Iraqi (6.2%, a difference of 0.020%), Thai (6.2%, a difference of 0.060%), Immigrants from Northern Europe (6.2%, a difference of 0.080%), Immigrants from South Africa (6.2%, a difference of 0.23%), and Kiowa (6.2%, a difference of 0.31%).
| Demographics | Rating | Rank | 4 or more Vehicles in Household |
| Ukrainians | 47.6 /100 | #176 | Average 6.3% |
| Slovaks | 46.9 /100 | #177 | Average 6.3% |
| Belizeans | 44.5 /100 | #178 | Average 6.3% |
| Immigrants | Japan | 43.1 /100 | #179 | Average 6.3% |
| Syrians | 42.0 /100 | #180 | Average 6.3% |
| Yugoslavians | 41.1 /100 | #181 | Average 6.3% |
| South American Indians | 40.7 /100 | #182 | Average 6.3% |
| Immigrants | Burma/Myanmar | 37.5 /100 | #183 | Fair 6.2% |
| Iraqis | 37.3 /100 | #184 | Fair 6.2% |
| Thais | 36.9 /100 | #185 | Fair 6.2% |
| Immigrants | Northern Europe | 36.8 /100 | #186 | Fair 6.2% |
| Immigrants | South Africa | 35.4 /100 | #187 | Fair 6.2% |
| Kiowa | 34.7 /100 | #188 | Fair 6.2% |
| Immigrants | Eastern Asia | 33.3 /100 | #189 | Fair 6.2% |
| South Africans | 32.2 /100 | #190 | Fair 6.2% |