Immigrants from Norway vs Carpatho Rusyn 4 or more Vehicles in Household
COMPARE
Immigrants from Norway
Carpatho Rusyn
4 or more Vehicles in Household
4 or more Vehicles in Household Comparison
Immigrants from Norway
Carpatho Rusyns
6.1%
4 OR MORE VEHICLES IN HOUSEHOLD
21.8/ 100
METRIC RATING
199th/ 347
METRIC RANK
5.5%
4 OR MORE VEHICLES IN HOUSEHOLD
0.7/ 100
METRIC RATING
269th/ 347
METRIC RANK
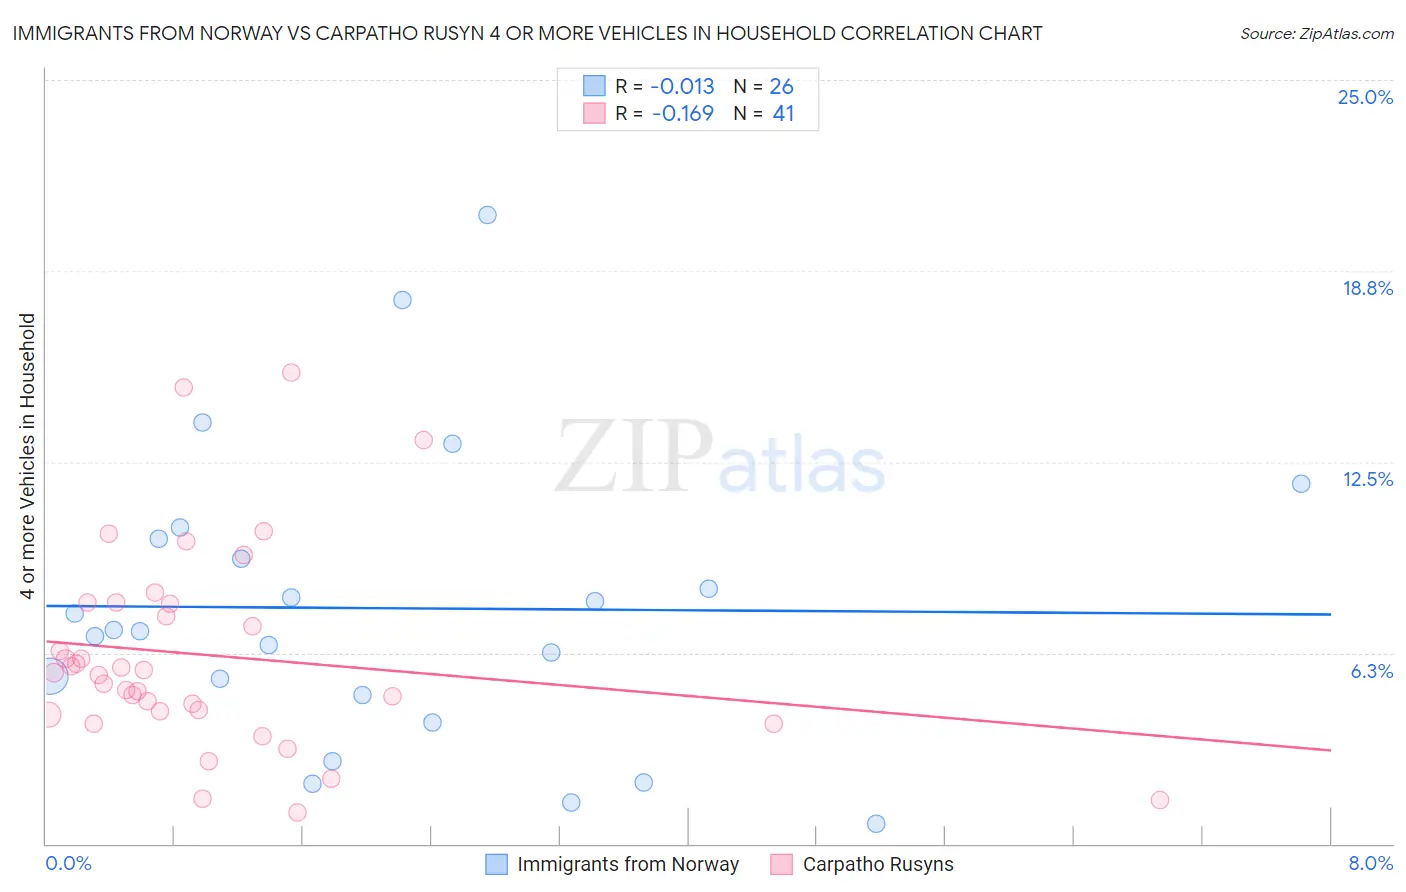
Immigrants from Norway vs Carpatho Rusyn 4 or more Vehicles in Household Correlation Chart
The statistical analysis conducted on geographies consisting of 116,239,195 people shows no correlation between the proportion of Immigrants from Norway and percentage of households with 4 or more vehicles available in the United States with a correlation coefficient (R) of -0.013 and weighted average of 6.1%. Similarly, the statistical analysis conducted on geographies consisting of 58,837,800 people shows a poor negative correlation between the proportion of Carpatho Rusyns and percentage of households with 4 or more vehicles available in the United States with a correlation coefficient (R) of -0.169 and weighted average of 5.5%, a difference of 10.6%.
4 or more Vehicles in Household Correlation Summary
| Measurement | Immigrants from Norway | Carpatho Rusyn |
| Minimum | 0.66% | 1.0% |
| Maximum | 20.6% | 15.4% |
| Range | 19.9% | 14.4% |
| Mean | 7.7% | 6.2% |
| Median | 7.0% | 5.6% |
| Interquartile 25% (IQ1) | 4.9% | 4.3% |
| Interquartile 75% (IQ3) | 10.0% | 7.9% |
| Interquartile Range (IQR) | 5.1% | 3.6% |
| Standard Deviation (Sample) | 4.8% | 3.3% |
| Standard Deviation (Population) | 4.7% | 3.3% |
Similar Demographics by 4 or more Vehicles in Household
Demographics Similar to Immigrants from Norway by 4 or more Vehicles in Household
In terms of 4 or more vehicles in household, the demographic groups most similar to Immigrants from Norway are Latvian (6.1%, a difference of 0.0%), Egyptian (6.1%, a difference of 0.060%), Immigrants from South Central Asia (6.1%, a difference of 0.070%), Immigrants from Portugal (6.1%, a difference of 0.080%), and Immigrants from Sierra Leone (6.1%, a difference of 0.20%).
| Demographics | Rating | Rank | 4 or more Vehicles in Household |
| Romanians | 30.7 /100 | #192 | Fair 6.2% |
| Immigrants | Kuwait | 28.0 /100 | #193 | Fair 6.2% |
| Immigrants | Sweden | 27.0 /100 | #194 | Fair 6.2% |
| Argentineans | 27.0 /100 | #195 | Fair 6.2% |
| Tsimshian | 26.4 /100 | #196 | Fair 6.2% |
| Immigrants | Sri Lanka | 23.7 /100 | #197 | Fair 6.1% |
| Immigrants | Portugal | 22.3 /100 | #198 | Fair 6.1% |
| Immigrants | Norway | 21.8 /100 | #199 | Fair 6.1% |
| Latvians | 21.7 /100 | #200 | Fair 6.1% |
| Egyptians | 21.4 /100 | #201 | Fair 6.1% |
| Immigrants | South Central Asia | 21.3 /100 | #202 | Fair 6.1% |
| Immigrants | Sierra Leone | 20.5 /100 | #203 | Fair 6.1% |
| Immigrants | Belize | 19.8 /100 | #204 | Poor 6.1% |
| Hondurans | 19.3 /100 | #205 | Poor 6.1% |
| Kenyans | 18.5 /100 | #206 | Poor 6.1% |
Demographics Similar to Carpatho Rusyns by 4 or more Vehicles in Household
In terms of 4 or more vehicles in household, the demographic groups most similar to Carpatho Rusyns are Colombian (5.5%, a difference of 0.16%), Okinawan (5.5%, a difference of 0.20%), Immigrants from Sudan (5.5%, a difference of 0.30%), Immigrants from Kazakhstan (5.5%, a difference of 0.50%), and Macedonian (5.5%, a difference of 0.53%).
| Demographics | Rating | Rank | 4 or more Vehicles in Household |
| Bermudans | 1.2 /100 | #262 | Tragic 5.6% |
| Immigrants | Saudi Arabia | 1.1 /100 | #263 | Tragic 5.6% |
| Immigrants | Africa | 1.0 /100 | #264 | Tragic 5.6% |
| South Americans | 0.9 /100 | #265 | Tragic 5.6% |
| Immigrants | Nepal | 0.9 /100 | #266 | Tragic 5.6% |
| Immigrants | Ukraine | 0.9 /100 | #267 | Tragic 5.6% |
| Colombians | 0.7 /100 | #268 | Tragic 5.5% |
| Carpatho Rusyns | 0.7 /100 | #269 | Tragic 5.5% |
| Okinawans | 0.6 /100 | #270 | Tragic 5.5% |
| Immigrants | Sudan | 0.6 /100 | #271 | Tragic 5.5% |
| Immigrants | Kazakhstan | 0.6 /100 | #272 | Tragic 5.5% |
| Macedonians | 0.6 /100 | #273 | Tragic 5.5% |
| Blacks/African Americans | 0.6 /100 | #274 | Tragic 5.5% |
| Cambodians | 0.5 /100 | #275 | Tragic 5.5% |
| Immigrants | Latvia | 0.5 /100 | #276 | Tragic 5.5% |