Immigrants from Norway vs Immigrants from Pakistan 4 or more Vehicles in Household
COMPARE
Immigrants from Norway
Immigrants from Pakistan
4 or more Vehicles in Household
4 or more Vehicles in Household Comparison
Immigrants from Norway
Immigrants from Pakistan
6.1%
4 OR MORE VEHICLES IN HOUSEHOLD
21.8/ 100
METRIC RATING
199th/ 347
METRIC RANK
6.4%
4 OR MORE VEHICLES IN HOUSEHOLD
63.2/ 100
METRIC RATING
162nd/ 347
METRIC RANK
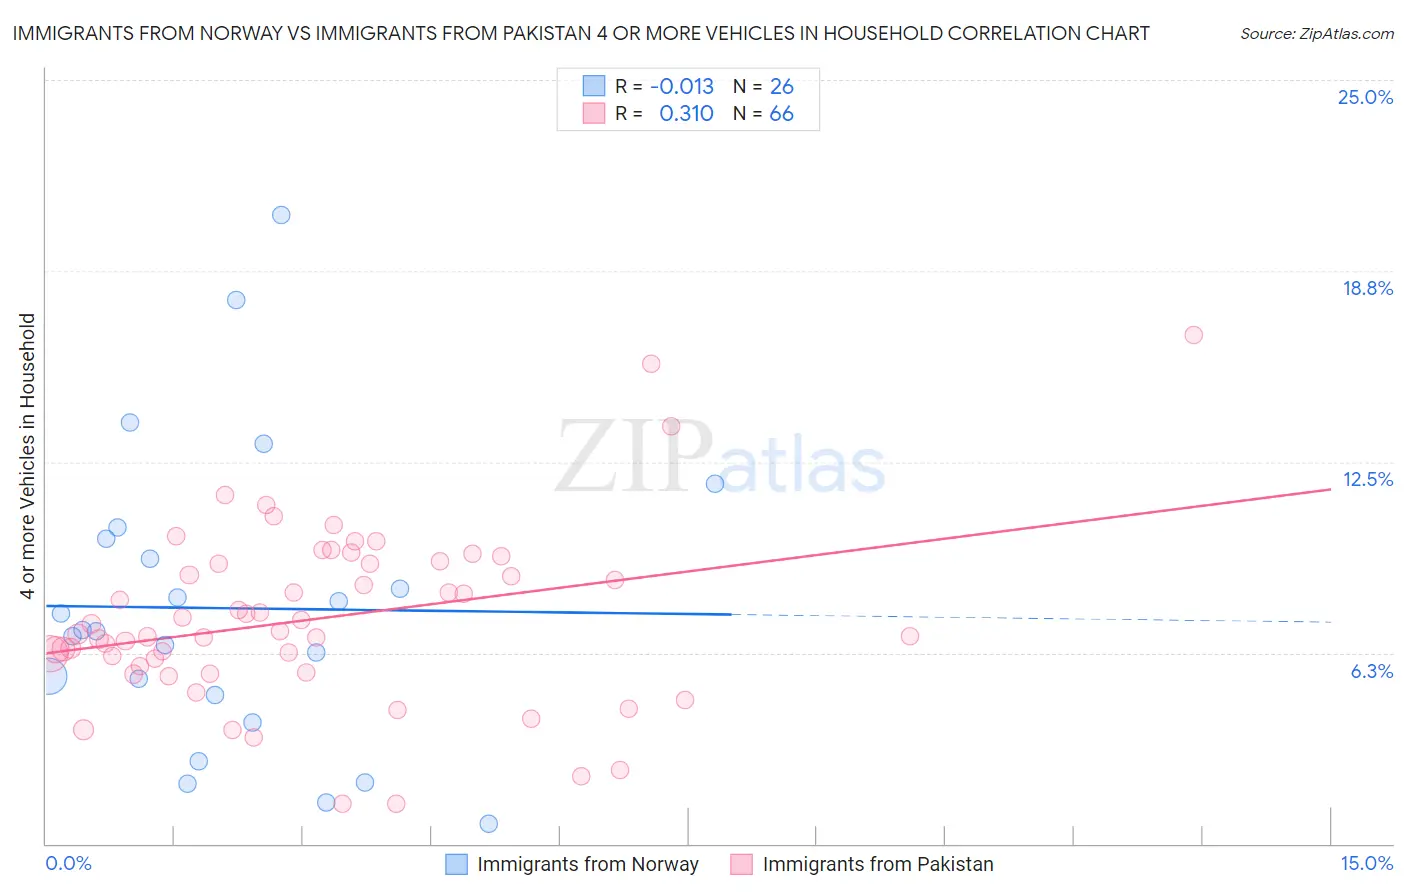
Immigrants from Norway vs Immigrants from Pakistan 4 or more Vehicles in Household Correlation Chart
The statistical analysis conducted on geographies consisting of 116,239,195 people shows no correlation between the proportion of Immigrants from Norway and percentage of households with 4 or more vehicles available in the United States with a correlation coefficient (R) of -0.013 and weighted average of 6.1%. Similarly, the statistical analysis conducted on geographies consisting of 282,597,587 people shows a mild positive correlation between the proportion of Immigrants from Pakistan and percentage of households with 4 or more vehicles available in the United States with a correlation coefficient (R) of 0.310 and weighted average of 6.4%, a difference of 4.8%.
4 or more Vehicles in Household Correlation Summary
| Measurement | Immigrants from Norway | Immigrants from Pakistan |
| Minimum | 0.66% | 1.3% |
| Maximum | 20.6% | 16.7% |
| Range | 19.9% | 15.4% |
| Mean | 7.7% | 7.4% |
| Median | 7.0% | 6.9% |
| Interquartile 25% (IQ1) | 4.9% | 5.8% |
| Interquartile 75% (IQ3) | 10.0% | 9.2% |
| Interquartile Range (IQR) | 5.1% | 3.4% |
| Standard Deviation (Sample) | 4.8% | 2.9% |
| Standard Deviation (Population) | 4.7% | 2.9% |
Similar Demographics by 4 or more Vehicles in Household
Demographics Similar to Immigrants from Norway by 4 or more Vehicles in Household
In terms of 4 or more vehicles in household, the demographic groups most similar to Immigrants from Norway are Latvian (6.1%, a difference of 0.0%), Egyptian (6.1%, a difference of 0.060%), Immigrants from South Central Asia (6.1%, a difference of 0.070%), Immigrants from Portugal (6.1%, a difference of 0.080%), and Immigrants from Sierra Leone (6.1%, a difference of 0.20%).
| Demographics | Rating | Rank | 4 or more Vehicles in Household |
| Romanians | 30.7 /100 | #192 | Fair 6.2% |
| Immigrants | Kuwait | 28.0 /100 | #193 | Fair 6.2% |
| Immigrants | Sweden | 27.0 /100 | #194 | Fair 6.2% |
| Argentineans | 27.0 /100 | #195 | Fair 6.2% |
| Tsimshian | 26.4 /100 | #196 | Fair 6.2% |
| Immigrants | Sri Lanka | 23.7 /100 | #197 | Fair 6.1% |
| Immigrants | Portugal | 22.3 /100 | #198 | Fair 6.1% |
| Immigrants | Norway | 21.8 /100 | #199 | Fair 6.1% |
| Latvians | 21.7 /100 | #200 | Fair 6.1% |
| Egyptians | 21.4 /100 | #201 | Fair 6.1% |
| Immigrants | South Central Asia | 21.3 /100 | #202 | Fair 6.1% |
| Immigrants | Sierra Leone | 20.5 /100 | #203 | Fair 6.1% |
| Immigrants | Belize | 19.8 /100 | #204 | Poor 6.1% |
| Hondurans | 19.3 /100 | #205 | Poor 6.1% |
| Kenyans | 18.5 /100 | #206 | Poor 6.1% |
Demographics Similar to Immigrants from Pakistan by 4 or more Vehicles in Household
In terms of 4 or more vehicles in household, the demographic groups most similar to Immigrants from Pakistan are Immigrants from Cameroon (6.4%, a difference of 0.13%), Chilean (6.4%, a difference of 0.22%), Hungarian (6.4%, a difference of 0.22%), Palestinian (6.4%, a difference of 0.28%), and Indian (Asian) (6.4%, a difference of 0.33%).
| Demographics | Rating | Rank | 4 or more Vehicles in Household |
| Iroquois | 70.4 /100 | #155 | Good 6.5% |
| Iranians | 69.9 /100 | #156 | Good 6.5% |
| Peruvians | 69.4 /100 | #157 | Good 6.5% |
| Zimbabweans | 67.1 /100 | #158 | Good 6.4% |
| Indians (Asian) | 66.3 /100 | #159 | Good 6.4% |
| Palestinians | 65.8 /100 | #160 | Good 6.4% |
| Immigrants | Cameroon | 64.4 /100 | #161 | Good 6.4% |
| Immigrants | Pakistan | 63.2 /100 | #162 | Good 6.4% |
| Chileans | 61.2 /100 | #163 | Good 6.4% |
| Hungarians | 61.1 /100 | #164 | Good 6.4% |
| Immigrants | Peru | 59.8 /100 | #165 | Average 6.4% |
| Immigrants | Denmark | 57.8 /100 | #166 | Average 6.4% |
| Poles | 56.9 /100 | #167 | Average 6.4% |
| Lebanese | 55.8 /100 | #168 | Average 6.4% |
| Estonians | 55.1 /100 | #169 | Average 6.4% |