Hawaiian vs Carpatho Rusyn 4 or more Vehicles in Household
COMPARE
Hawaiian
Carpatho Rusyn
4 or more Vehicles in Household
4 or more Vehicles in Household Comparison
Hawaiians
Carpatho Rusyns
8.9%
4 OR MORE VEHICLES IN HOUSEHOLD
100.0/ 100
METRIC RATING
13th/ 347
METRIC RANK
5.5%
4 OR MORE VEHICLES IN HOUSEHOLD
0.7/ 100
METRIC RATING
269th/ 347
METRIC RANK
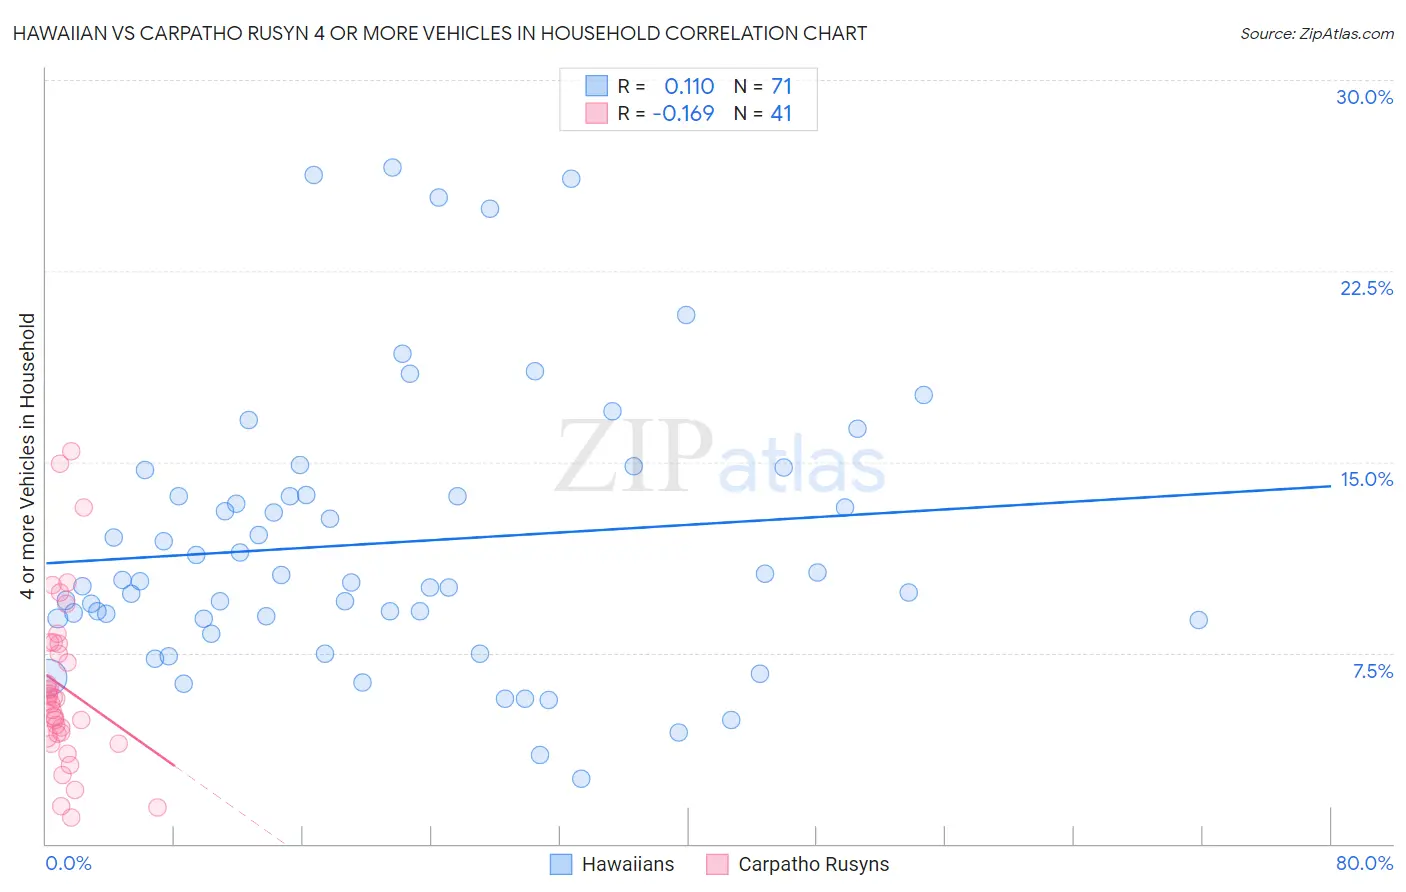
Hawaiian vs Carpatho Rusyn 4 or more Vehicles in Household Correlation Chart
The statistical analysis conducted on geographies consisting of 326,237,649 people shows a poor positive correlation between the proportion of Hawaiians and percentage of households with 4 or more vehicles available in the United States with a correlation coefficient (R) of 0.110 and weighted average of 8.9%. Similarly, the statistical analysis conducted on geographies consisting of 58,837,800 people shows a poor negative correlation between the proportion of Carpatho Rusyns and percentage of households with 4 or more vehicles available in the United States with a correlation coefficient (R) of -0.169 and weighted average of 5.5%, a difference of 61.6%.
4 or more Vehicles in Household Correlation Summary
| Measurement | Hawaiian | Carpatho Rusyn |
| Minimum | 2.6% | 1.0% |
| Maximum | 26.6% | 15.4% |
| Range | 24.0% | 14.4% |
| Mean | 11.8% | 6.2% |
| Median | 10.3% | 5.6% |
| Interquartile 25% (IQ1) | 8.8% | 4.3% |
| Interquartile 75% (IQ3) | 13.7% | 7.9% |
| Interquartile Range (IQR) | 4.9% | 3.6% |
| Standard Deviation (Sample) | 5.4% | 3.3% |
| Standard Deviation (Population) | 5.4% | 3.3% |
Similar Demographics by 4 or more Vehicles in Household
Demographics Similar to Hawaiians by 4 or more Vehicles in Household
In terms of 4 or more vehicles in household, the demographic groups most similar to Hawaiians are Mexican (8.9%, a difference of 0.010%), Immigrants from Mexico (9.0%, a difference of 0.69%), Paiute (9.0%, a difference of 0.81%), Chinese (8.8%, a difference of 1.0%), and Shoshone (8.8%, a difference of 1.0%).
| Demographics | Rating | Rank | 4 or more Vehicles in Household |
| Puget Sound Salish | 100.0 /100 | #6 | Exceptional 9.4% |
| Native Hawaiians | 100.0 /100 | #7 | Exceptional 9.4% |
| Arapaho | 100.0 /100 | #8 | Exceptional 9.4% |
| Samoans | 100.0 /100 | #9 | Exceptional 9.2% |
| Paiute | 100.0 /100 | #10 | Exceptional 9.0% |
| Immigrants | Mexico | 100.0 /100 | #11 | Exceptional 9.0% |
| Mexicans | 100.0 /100 | #12 | Exceptional 8.9% |
| Hawaiians | 100.0 /100 | #13 | Exceptional 8.9% |
| Chinese | 100.0 /100 | #14 | Exceptional 8.8% |
| Shoshone | 100.0 /100 | #15 | Exceptional 8.8% |
| Lumbee | 100.0 /100 | #16 | Exceptional 8.8% |
| Ute | 100.0 /100 | #17 | Exceptional 8.8% |
| Nepalese | 100.0 /100 | #18 | Exceptional 8.7% |
| Koreans | 100.0 /100 | #19 | Exceptional 8.6% |
| Pueblo | 100.0 /100 | #20 | Exceptional 8.6% |
Demographics Similar to Carpatho Rusyns by 4 or more Vehicles in Household
In terms of 4 or more vehicles in household, the demographic groups most similar to Carpatho Rusyns are Colombian (5.5%, a difference of 0.16%), Okinawan (5.5%, a difference of 0.20%), Immigrants from Sudan (5.5%, a difference of 0.30%), Immigrants from Kazakhstan (5.5%, a difference of 0.50%), and Macedonian (5.5%, a difference of 0.53%).
| Demographics | Rating | Rank | 4 or more Vehicles in Household |
| Bermudans | 1.2 /100 | #262 | Tragic 5.6% |
| Immigrants | Saudi Arabia | 1.1 /100 | #263 | Tragic 5.6% |
| Immigrants | Africa | 1.0 /100 | #264 | Tragic 5.6% |
| South Americans | 0.9 /100 | #265 | Tragic 5.6% |
| Immigrants | Nepal | 0.9 /100 | #266 | Tragic 5.6% |
| Immigrants | Ukraine | 0.9 /100 | #267 | Tragic 5.6% |
| Colombians | 0.7 /100 | #268 | Tragic 5.5% |
| Carpatho Rusyns | 0.7 /100 | #269 | Tragic 5.5% |
| Okinawans | 0.6 /100 | #270 | Tragic 5.5% |
| Immigrants | Sudan | 0.6 /100 | #271 | Tragic 5.5% |
| Immigrants | Kazakhstan | 0.6 /100 | #272 | Tragic 5.5% |
| Macedonians | 0.6 /100 | #273 | Tragic 5.5% |
| Blacks/African Americans | 0.6 /100 | #274 | Tragic 5.5% |
| Cambodians | 0.5 /100 | #275 | Tragic 5.5% |
| Immigrants | Latvia | 0.5 /100 | #276 | Tragic 5.5% |