Immigrants from Nepal vs Immigrants from Norway Family Households
COMPARE
Immigrants from Nepal
Immigrants from Norway
Family Households
Family Households Comparison
Immigrants from Nepal
Immigrants from Norway
62.7%
FAMILY HOUSEHOLDS
0.1/ 100
METRIC RATING
289th/ 347
METRIC RANK
62.1%
FAMILY HOUSEHOLDS
0.0/ 100
METRIC RATING
307th/ 347
METRIC RANK
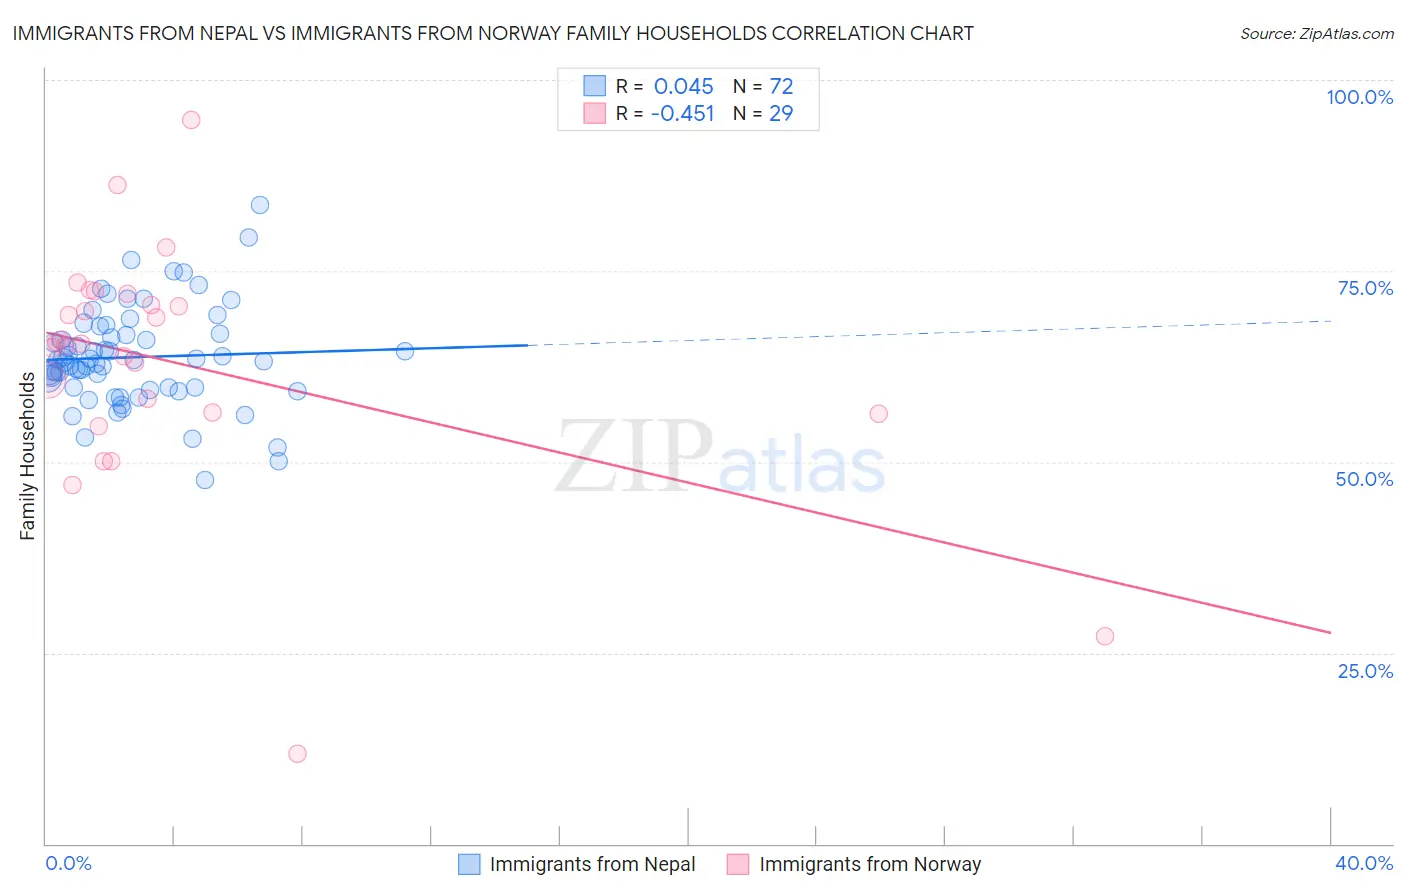
Immigrants from Nepal vs Immigrants from Norway Family Households Correlation Chart
The statistical analysis conducted on geographies consisting of 186,706,837 people shows no correlation between the proportion of Immigrants from Nepal and percentage of family households in the United States with a correlation coefficient (R) of 0.045 and weighted average of 62.7%. Similarly, the statistical analysis conducted on geographies consisting of 116,686,104 people shows a moderate negative correlation between the proportion of Immigrants from Norway and percentage of family households in the United States with a correlation coefficient (R) of -0.451 and weighted average of 62.1%, a difference of 0.98%.
Family Households Correlation Summary
| Measurement | Immigrants from Nepal | Immigrants from Norway |
| Minimum | 47.6% | 11.8% |
| Maximum | 83.7% | 94.8% |
| Range | 36.1% | 83.1% |
| Mean | 63.7% | 62.9% |
| Median | 63.3% | 65.4% |
| Interquartile 25% (IQ1) | 59.7% | 56.4% |
| Interquartile 75% (IQ3) | 66.7% | 71.3% |
| Interquartile Range (IQR) | 7.0% | 14.9% |
| Standard Deviation (Sample) | 6.5% | 15.9% |
| Standard Deviation (Population) | 6.4% | 15.6% |
Demographics Similar to Immigrants from Nepal and Immigrants from Norway by Family Households
In terms of family households, the demographic groups most similar to Immigrants from Nepal are Immigrants from Grenada (62.6%, a difference of 0.080%), Immigrants from Uganda (62.7%, a difference of 0.090%), U.S. Virgin Islander (62.6%, a difference of 0.13%), Immigrants from Burma/Myanmar (62.6%, a difference of 0.18%), and Immigrants from Sweden (62.5%, a difference of 0.31%). Similarly, the demographic groups most similar to Immigrants from Norway are Chippewa (62.1%, a difference of 0.0%), African (62.1%, a difference of 0.080%), Bermudan (62.2%, a difference of 0.10%), Iroquois (62.2%, a difference of 0.26%), and Cree (62.3%, a difference of 0.36%).
| Demographics | Rating | Rank | Family Households |
| Immigrants | Uganda | 0.1 /100 | #288 | Tragic 62.7% |
| Immigrants | Nepal | 0.1 /100 | #289 | Tragic 62.7% |
| Immigrants | Grenada | 0.0 /100 | #290 | Tragic 62.6% |
| U.S. Virgin Islanders | 0.0 /100 | #291 | Tragic 62.6% |
| Immigrants | Burma/Myanmar | 0.0 /100 | #292 | Tragic 62.6% |
| Immigrants | Sweden | 0.0 /100 | #293 | Tragic 62.5% |
| Barbadians | 0.0 /100 | #294 | Tragic 62.5% |
| Okinawans | 0.0 /100 | #295 | Tragic 62.5% |
| Slovenes | 0.0 /100 | #296 | Tragic 62.4% |
| French American Indians | 0.0 /100 | #297 | Tragic 62.4% |
| Immigrants | Spain | 0.0 /100 | #298 | Tragic 62.4% |
| Immigrants | Kuwait | 0.0 /100 | #299 | Tragic 62.4% |
| Immigrants | Africa | 0.0 /100 | #300 | Tragic 62.4% |
| Immigrants | Albania | 0.0 /100 | #301 | Tragic 62.4% |
| Immigrants | Kenya | 0.0 /100 | #302 | Tragic 62.3% |
| Cree | 0.0 /100 | #303 | Tragic 62.3% |
| Iroquois | 0.0 /100 | #304 | Tragic 62.2% |
| Bermudans | 0.0 /100 | #305 | Tragic 62.2% |
| Africans | 0.0 /100 | #306 | Tragic 62.1% |
| Immigrants | Norway | 0.0 /100 | #307 | Tragic 62.1% |
| Chippewa | 0.0 /100 | #308 | Tragic 62.1% |