Ecuadorian vs Immigrants from Norway 1 or more Vehicles in Household
COMPARE
Ecuadorian
Immigrants from Norway
1 or more Vehicles in Household
1 or more Vehicles in Household Comparison
Ecuadorians
Immigrants from Norway
77.9%
1 OR MORE VEHICLES IN HOUSEHOLD
0.0/ 100
METRIC RATING
328th/ 347
METRIC RANK
88.7%
1 OR MORE VEHICLES IN HOUSEHOLD
5.5/ 100
METRIC RATING
228th/ 347
METRIC RANK
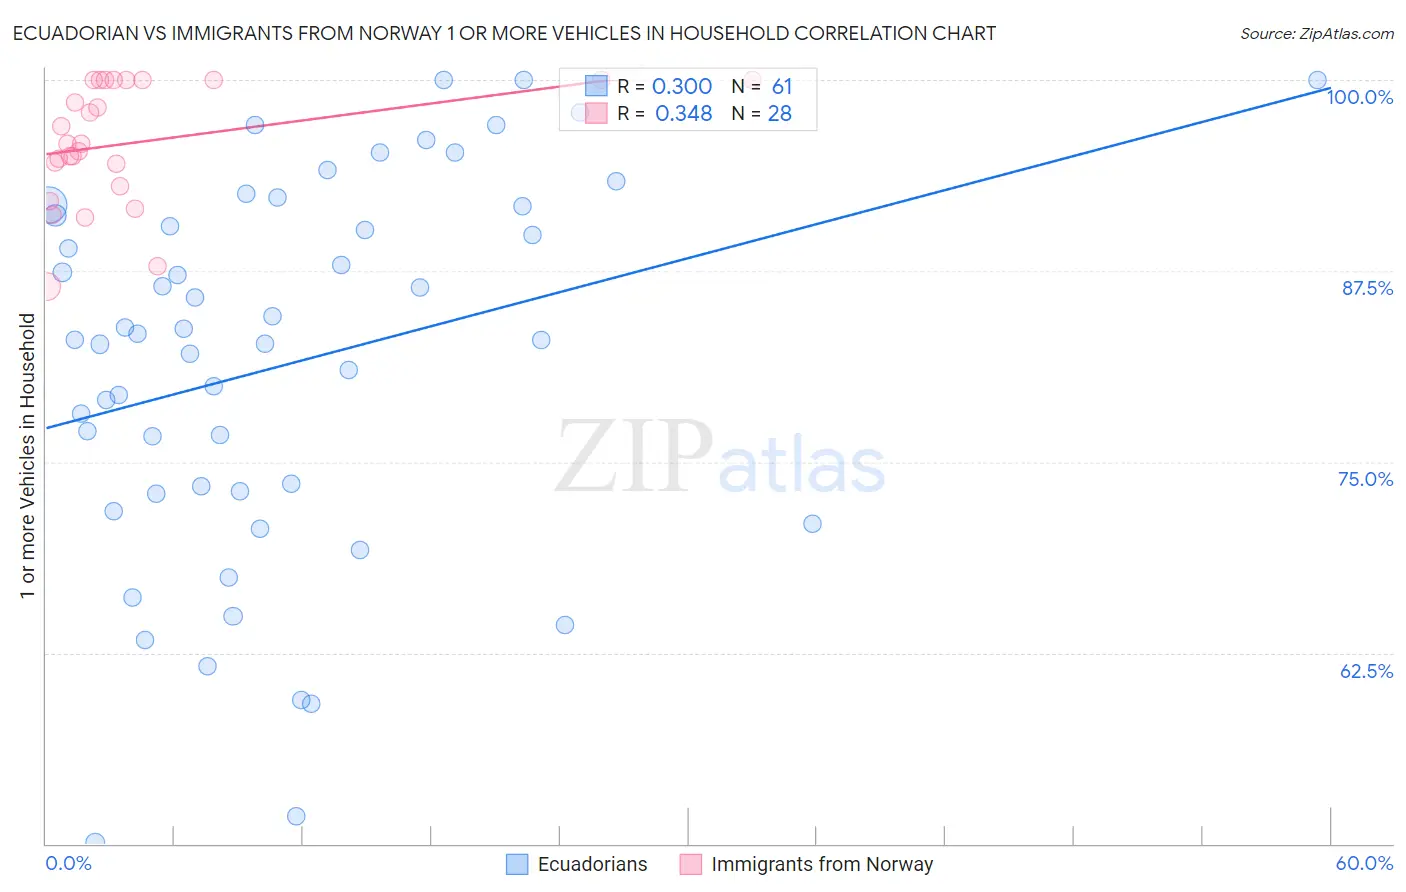
Ecuadorian vs Immigrants from Norway 1 or more Vehicles in Household Correlation Chart
The statistical analysis conducted on geographies consisting of 317,563,927 people shows a mild positive correlation between the proportion of Ecuadorians and percentage of households with 1 or more vehicles available in the United States with a correlation coefficient (R) of 0.300 and weighted average of 77.9%. Similarly, the statistical analysis conducted on geographies consisting of 116,609,414 people shows a mild positive correlation between the proportion of Immigrants from Norway and percentage of households with 1 or more vehicles available in the United States with a correlation coefficient (R) of 0.348 and weighted average of 88.7%, a difference of 13.8%.
1 or more Vehicles in Household Correlation Summary
| Measurement | Ecuadorian | Immigrants from Norway |
| Minimum | 50.1% | 86.5% |
| Maximum | 100.0% | 100.0% |
| Range | 49.9% | 13.5% |
| Mean | 81.4% | 95.9% |
| Median | 83.0% | 95.8% |
| Interquartile 25% (IQ1) | 73.0% | 93.7% |
| Interquartile 75% (IQ3) | 91.4% | 100.0% |
| Interquartile Range (IQR) | 18.4% | 6.3% |
| Standard Deviation (Sample) | 12.3% | 3.9% |
| Standard Deviation (Population) | 12.2% | 3.9% |
Similar Demographics by 1 or more Vehicles in Household
Demographics Similar to Ecuadorians by 1 or more Vehicles in Household
In terms of 1 or more vehicles in household, the demographic groups most similar to Ecuadorians are Immigrants from Dominica (77.8%, a difference of 0.14%), Immigrants from Senegal (79.0%, a difference of 1.3%), Immigrants from Trinidad and Tobago (76.8%, a difference of 1.5%), Immigrants from West Indies (79.5%, a difference of 2.0%), and West Indian (76.4%, a difference of 2.1%).
| Demographics | Rating | Rank | 1 or more Vehicles in Household |
| Jamaicans | 0.0 /100 | #321 | Tragic 82.1% |
| Immigrants | Cabo Verde | 0.0 /100 | #322 | Tragic 81.6% |
| Immigrants | Yemen | 0.0 /100 | #323 | Tragic 80.5% |
| Immigrants | Caribbean | 0.0 /100 | #324 | Tragic 80.4% |
| Senegalese | 0.0 /100 | #325 | Tragic 80.4% |
| Immigrants | West Indies | 0.0 /100 | #326 | Tragic 79.5% |
| Immigrants | Senegal | 0.0 /100 | #327 | Tragic 79.0% |
| Ecuadorians | 0.0 /100 | #328 | Tragic 77.9% |
| Immigrants | Dominica | 0.0 /100 | #329 | Tragic 77.8% |
| Immigrants | Trinidad and Tobago | 0.0 /100 | #330 | Tragic 76.8% |
| West Indians | 0.0 /100 | #331 | Tragic 76.4% |
| Trinidadians and Tobagonians | 0.0 /100 | #332 | Tragic 76.3% |
| Immigrants | Ecuador | 0.0 /100 | #333 | Tragic 76.2% |
| Immigrants | Bangladesh | 0.0 /100 | #334 | Tragic 74.3% |
| Barbadians | 0.0 /100 | #335 | Tragic 74.0% |
Demographics Similar to Immigrants from Norway by 1 or more Vehicles in Household
In terms of 1 or more vehicles in household, the demographic groups most similar to Immigrants from Norway are Cheyenne (88.7%, a difference of 0.010%), Ute (88.7%, a difference of 0.010%), Immigrants from Romania (88.7%, a difference of 0.010%), Immigrants from Sierra Leone (88.7%, a difference of 0.030%), and Cree (88.7%, a difference of 0.040%).
| Demographics | Rating | Rank | 1 or more Vehicles in Household |
| Peruvians | 7.9 /100 | #221 | Tragic 88.8% |
| Uruguayans | 7.0 /100 | #222 | Tragic 88.8% |
| Immigrants | South America | 7.0 /100 | #223 | Tragic 88.8% |
| Immigrants | Hong Kong | 6.2 /100 | #224 | Tragic 88.7% |
| Cree | 6.0 /100 | #225 | Tragic 88.7% |
| Cheyenne | 5.7 /100 | #226 | Tragic 88.7% |
| Ute | 5.6 /100 | #227 | Tragic 88.7% |
| Immigrants | Norway | 5.5 /100 | #228 | Tragic 88.7% |
| Immigrants | Romania | 5.4 /100 | #229 | Tragic 88.7% |
| Immigrants | Sierra Leone | 5.2 /100 | #230 | Tragic 88.7% |
| Russians | 5.0 /100 | #231 | Tragic 88.7% |
| Immigrants | Japan | 4.9 /100 | #232 | Tragic 88.7% |
| Houma | 4.8 /100 | #233 | Tragic 88.6% |
| Immigrants | Peru | 4.7 /100 | #234 | Tragic 88.6% |
| Paiute | 4.6 /100 | #235 | Tragic 88.6% |