Pima vs Barbadian 2 or more Vehicles in Household
COMPARE
Pima
Barbadian
2 or more Vehicles in Household
2 or more Vehicles in Household Comparison
Pima
Barbadians
52.0%
2 OR MORE VEHICLES IN HOUSEHOLD
0.2/ 100
METRIC RATING
268th/ 347
METRIC RANK
38.3%
2 OR MORE VEHICLES IN HOUSEHOLD
0.0/ 100
METRIC RATING
337th/ 347
METRIC RANK
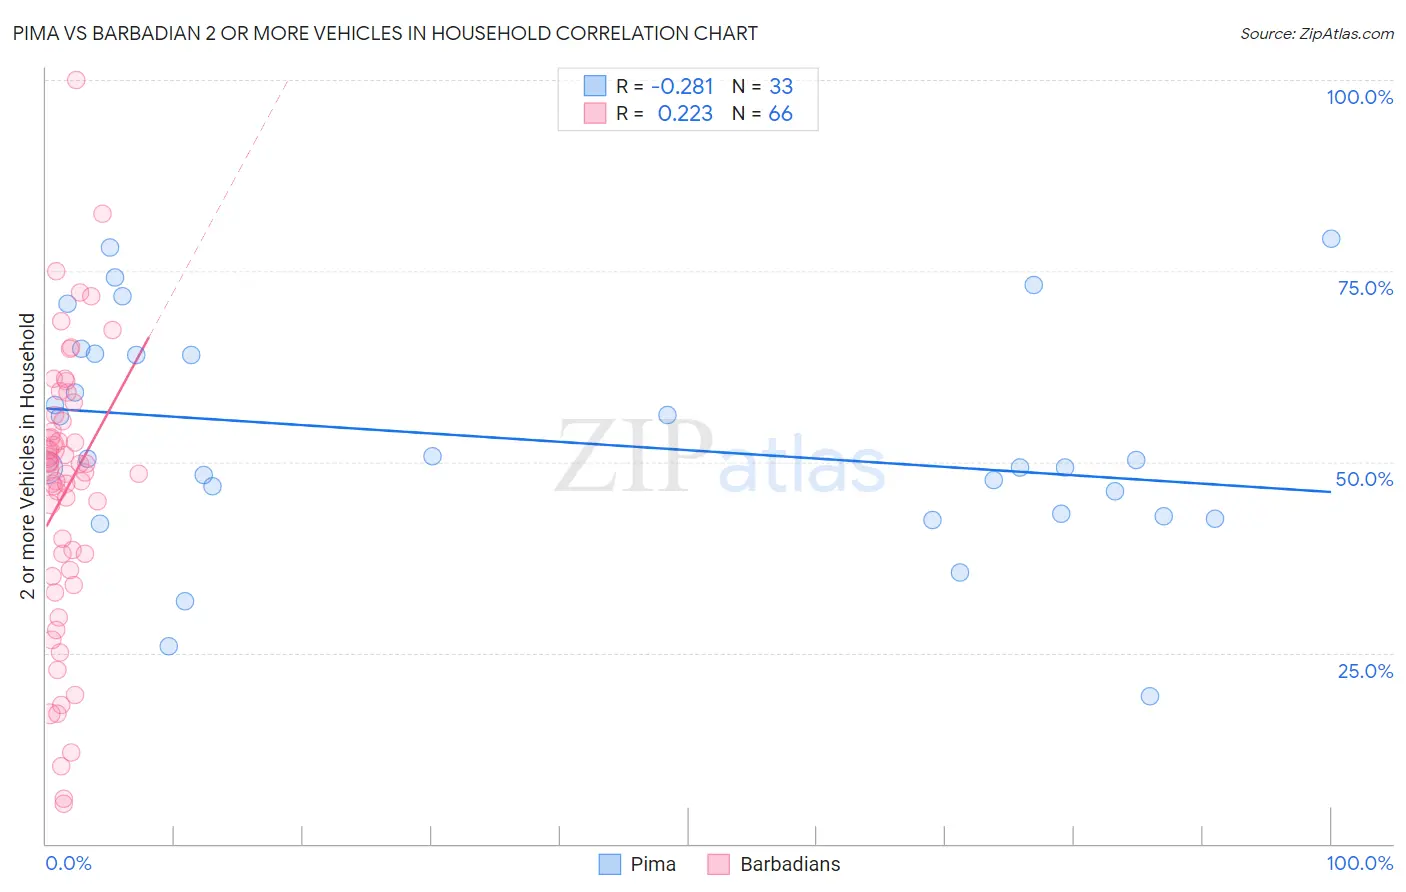
Pima vs Barbadian 2 or more Vehicles in Household Correlation Chart
The statistical analysis conducted on geographies consisting of 61,539,452 people shows a weak negative correlation between the proportion of Pima and percentage of households with 2 or more vehicles available in the United States with a correlation coefficient (R) of -0.281 and weighted average of 52.0%. Similarly, the statistical analysis conducted on geographies consisting of 141,285,511 people shows a weak positive correlation between the proportion of Barbadians and percentage of households with 2 or more vehicles available in the United States with a correlation coefficient (R) of 0.223 and weighted average of 38.3%, a difference of 35.7%.
2 or more Vehicles in Household Correlation Summary
| Measurement | Pima | Barbadian |
| Minimum | 19.4% | 5.2% |
| Maximum | 79.2% | 100.0% |
| Range | 59.9% | 94.8% |
| Mean | 52.9% | 46.2% |
| Median | 50.2% | 48.8% |
| Interquartile 25% (IQ1) | 43.0% | 35.8% |
| Interquartile 75% (IQ3) | 64.1% | 55.4% |
| Interquartile Range (IQR) | 21.1% | 19.6% |
| Standard Deviation (Sample) | 14.6% | 18.2% |
| Standard Deviation (Population) | 14.3% | 18.0% |
Similar Demographics by 2 or more Vehicles in Household
Demographics Similar to Pima by 2 or more Vehicles in Household
In terms of 2 or more vehicles in household, the demographic groups most similar to Pima are Immigrants from Colombia (52.0%, a difference of 0.010%), Honduran (52.0%, a difference of 0.010%), Immigrants from Ireland (52.0%, a difference of 0.030%), Immigrants from France (52.0%, a difference of 0.060%), and Immigrants from Congo (52.1%, a difference of 0.20%).
| Demographics | Rating | Rank | 2 or more Vehicles in Household |
| Immigrants | Australia | 0.5 /100 | #261 | Tragic 52.4% |
| Immigrants | Northern Africa | 0.4 /100 | #262 | Tragic 52.3% |
| Immigrants | Southern Europe | 0.4 /100 | #263 | Tragic 52.3% |
| Immigrants | Latvia | 0.4 /100 | #264 | Tragic 52.2% |
| Immigrants | Congo | 0.3 /100 | #265 | Tragic 52.1% |
| Immigrants | France | 0.2 /100 | #266 | Tragic 52.0% |
| Immigrants | Colombia | 0.2 /100 | #267 | Tragic 52.0% |
| Pima | 0.2 /100 | #268 | Tragic 52.0% |
| Hondurans | 0.2 /100 | #269 | Tragic 52.0% |
| Immigrants | Ireland | 0.2 /100 | #270 | Tragic 52.0% |
| South Americans | 0.2 /100 | #271 | Tragic 51.9% |
| Sub-Saharan Africans | 0.2 /100 | #272 | Tragic 51.9% |
| Israelis | 0.2 /100 | #273 | Tragic 51.9% |
| Africans | 0.2 /100 | #274 | Tragic 51.8% |
| Immigrants | Honduras | 0.2 /100 | #275 | Tragic 51.8% |
Demographics Similar to Barbadians by 2 or more Vehicles in Household
In terms of 2 or more vehicles in household, the demographic groups most similar to Barbadians are Vietnamese (38.5%, a difference of 0.41%), Immigrants from Bangladesh (38.8%, a difference of 1.1%), Immigrants from Uzbekistan (37.9%, a difference of 1.2%), Immigrants from Trinidad and Tobago (40.3%, a difference of 5.0%), and Immigrants from Ecuador (40.5%, a difference of 5.6%).
| Demographics | Rating | Rank | 2 or more Vehicles in Household |
| Immigrants | Dominica | 0.0 /100 | #330 | Tragic 41.6% |
| West Indians | 0.0 /100 | #331 | Tragic 41.3% |
| Trinidadians and Tobagonians | 0.0 /100 | #332 | Tragic 40.9% |
| Immigrants | Ecuador | 0.0 /100 | #333 | Tragic 40.5% |
| Immigrants | Trinidad and Tobago | 0.0 /100 | #334 | Tragic 40.3% |
| Immigrants | Bangladesh | 0.0 /100 | #335 | Tragic 38.8% |
| Vietnamese | 0.0 /100 | #336 | Tragic 38.5% |
| Barbadians | 0.0 /100 | #337 | Tragic 38.3% |
| Immigrants | Uzbekistan | 0.0 /100 | #338 | Tragic 37.9% |
| Immigrants | Barbados | 0.0 /100 | #339 | Tragic 35.8% |
| British West Indians | 0.0 /100 | #340 | Tragic 35.4% |
| Guyanese | 0.0 /100 | #341 | Tragic 35.4% |
| Dominicans | 0.0 /100 | #342 | Tragic 35.3% |
| Immigrants | Guyana | 0.0 /100 | #343 | Tragic 35.0% |
| Yup'ik | 0.0 /100 | #344 | Tragic 34.9% |