Immigrants from Mexico vs Slovak 3 or more Vehicles in Household
COMPARE
Immigrants from Mexico
Slovak
3 or more Vehicles in Household
3 or more Vehicles in Household Comparison
Immigrants from Mexico
Slovaks
24.6%
3 OR MORE VEHICLES IN HOUSEHOLD
100.0/ 100
METRIC RATING
14th/ 347
METRIC RANK
20.1%
3 OR MORE VEHICLES IN HOUSEHOLD
83.0/ 100
METRIC RATING
147th/ 347
METRIC RANK
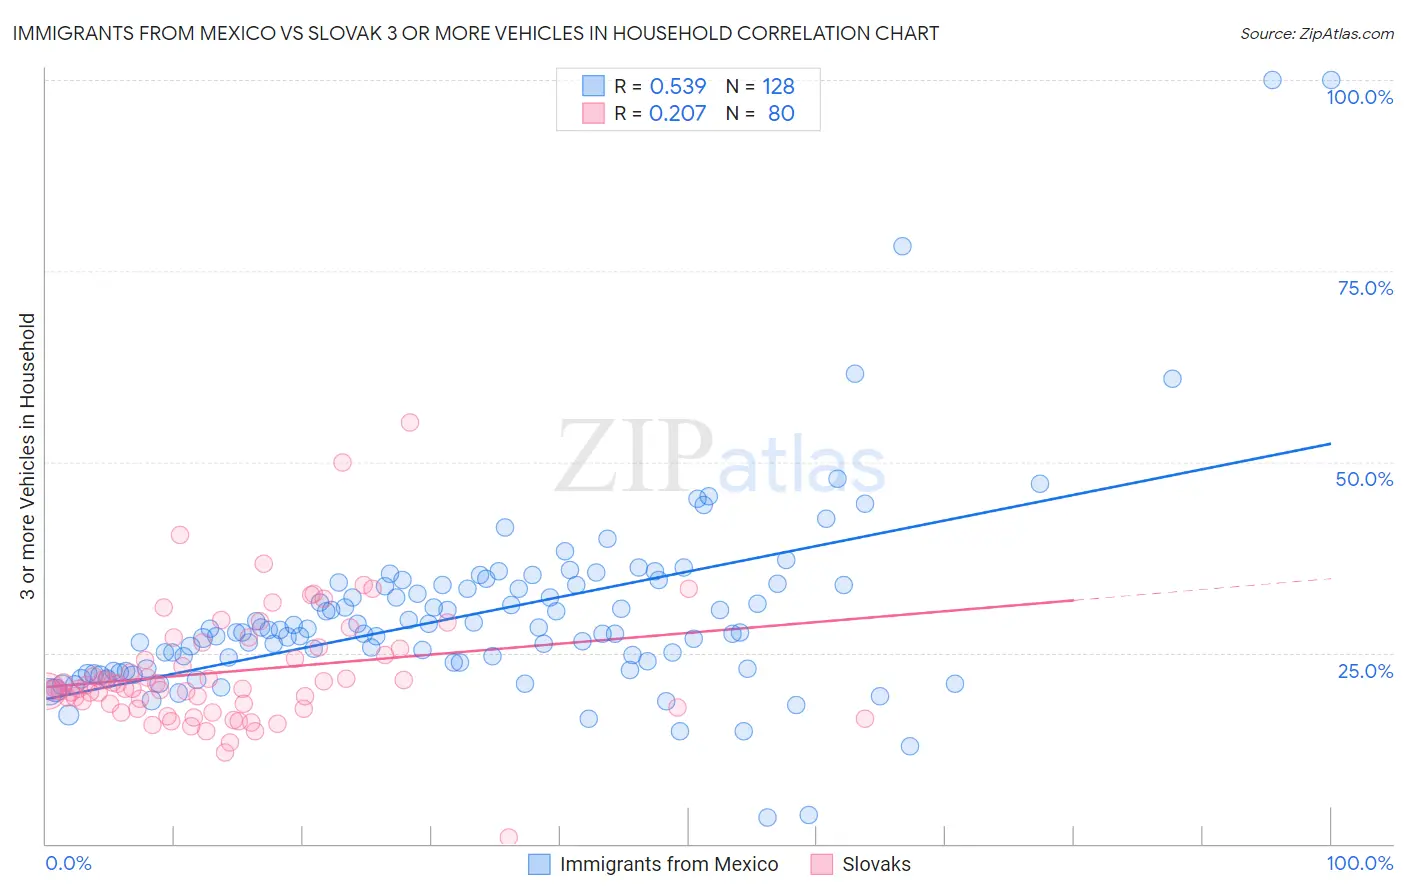
Immigrants from Mexico vs Slovak 3 or more Vehicles in Household Correlation Chart
The statistical analysis conducted on geographies consisting of 513,239,841 people shows a substantial positive correlation between the proportion of Immigrants from Mexico and percentage of households with 3 or more vehicles available in the United States with a correlation coefficient (R) of 0.539 and weighted average of 24.6%. Similarly, the statistical analysis conducted on geographies consisting of 397,587,914 people shows a weak positive correlation between the proportion of Slovaks and percentage of households with 3 or more vehicles available in the United States with a correlation coefficient (R) of 0.207 and weighted average of 20.1%, a difference of 22.5%.
3 or more Vehicles in Household Correlation Summary
| Measurement | Immigrants from Mexico | Slovak |
| Minimum | 3.4% | 0.89% |
| Maximum | 100.0% | 55.1% |
| Range | 96.6% | 54.2% |
| Mean | 30.1% | 22.5% |
| Median | 27.7% | 20.4% |
| Interquartile 25% (IQ1) | 22.9% | 18.1% |
| Interquartile 75% (IQ3) | 33.9% | 25.7% |
| Interquartile Range (IQR) | 11.0% | 7.5% |
| Standard Deviation (Sample) | 13.1% | 7.9% |
| Standard Deviation (Population) | 13.0% | 7.9% |
Similar Demographics by 3 or more Vehicles in Household
Demographics Similar to Immigrants from Mexico by 3 or more Vehicles in Household
In terms of 3 or more vehicles in household, the demographic groups most similar to Immigrants from Mexico are Mexican (24.7%, a difference of 0.44%), Danish (24.7%, a difference of 0.52%), Shoshone (24.9%, a difference of 1.2%), Nepalese (24.9%, a difference of 1.3%), and Hawaiian (24.3%, a difference of 1.4%).
| Demographics | Rating | Rank | 3 or more Vehicles in Household |
| Colville | 100.0 /100 | #7 | Exceptional 25.8% |
| Samoans | 100.0 /100 | #8 | Exceptional 25.0% |
| Native Hawaiians | 100.0 /100 | #9 | Exceptional 24.9% |
| Nepalese | 100.0 /100 | #10 | Exceptional 24.9% |
| Shoshone | 100.0 /100 | #11 | Exceptional 24.9% |
| Danes | 100.0 /100 | #12 | Exceptional 24.7% |
| Mexicans | 100.0 /100 | #13 | Exceptional 24.7% |
| Immigrants | Mexico | 100.0 /100 | #14 | Exceptional 24.6% |
| Hawaiians | 100.0 /100 | #15 | Exceptional 24.3% |
| Basques | 100.0 /100 | #16 | Exceptional 24.3% |
| Koreans | 100.0 /100 | #17 | Exceptional 24.1% |
| Norwegians | 100.0 /100 | #18 | Exceptional 23.9% |
| Chinese | 100.0 /100 | #19 | Exceptional 23.9% |
| Paiute | 100.0 /100 | #20 | Exceptional 23.8% |
| Immigrants | Vietnam | 100.0 /100 | #21 | Exceptional 23.8% |
Demographics Similar to Slovaks by 3 or more Vehicles in Household
In terms of 3 or more vehicles in household, the demographic groups most similar to Slovaks are Guatemalan (20.1%, a difference of 0.060%), Australian (20.1%, a difference of 0.080%), Palestinian (20.1%, a difference of 0.12%), Iranian (20.1%, a difference of 0.13%), and Jordanian (20.1%, a difference of 0.19%).
| Demographics | Rating | Rank | 3 or more Vehicles in Household |
| French American Indians | 85.3 /100 | #140 | Excellent 20.1% |
| Ottawa | 84.9 /100 | #141 | Excellent 20.1% |
| Jordanians | 84.4 /100 | #142 | Excellent 20.1% |
| Lithuanians | 84.4 /100 | #143 | Excellent 20.1% |
| Iranians | 84.0 /100 | #144 | Excellent 20.1% |
| Palestinians | 83.9 /100 | #145 | Excellent 20.1% |
| Australians | 83.6 /100 | #146 | Excellent 20.1% |
| Slovaks | 83.0 /100 | #147 | Excellent 20.1% |
| Guatemalans | 82.6 /100 | #148 | Excellent 20.1% |
| Immigrants | Iran | 80.9 /100 | #149 | Excellent 20.0% |
| Immigrants | Immigrants | 80.8 /100 | #150 | Excellent 20.0% |
| Taiwanese | 80.6 /100 | #151 | Excellent 20.0% |
| Lebanese | 79.8 /100 | #152 | Good 20.0% |
| Yuman | 75.6 /100 | #153 | Good 19.9% |
| Immigrants | Jordan | 75.0 /100 | #154 | Good 19.9% |