Immigrants from Mexico vs Immigrants from Asia 4 or more Vehicles in Household
COMPARE
Immigrants from Mexico
Immigrants from Asia
4 or more Vehicles in Household
4 or more Vehicles in Household Comparison
Immigrants from Mexico
Immigrants from Asia
9.0%
4 OR MORE VEHICLES IN HOUSEHOLD
100.0/ 100
METRIC RATING
11th/ 347
METRIC RANK
6.8%
4 OR MORE VEHICLES IN HOUSEHOLD
94.4/ 100
METRIC RATING
124th/ 347
METRIC RANK
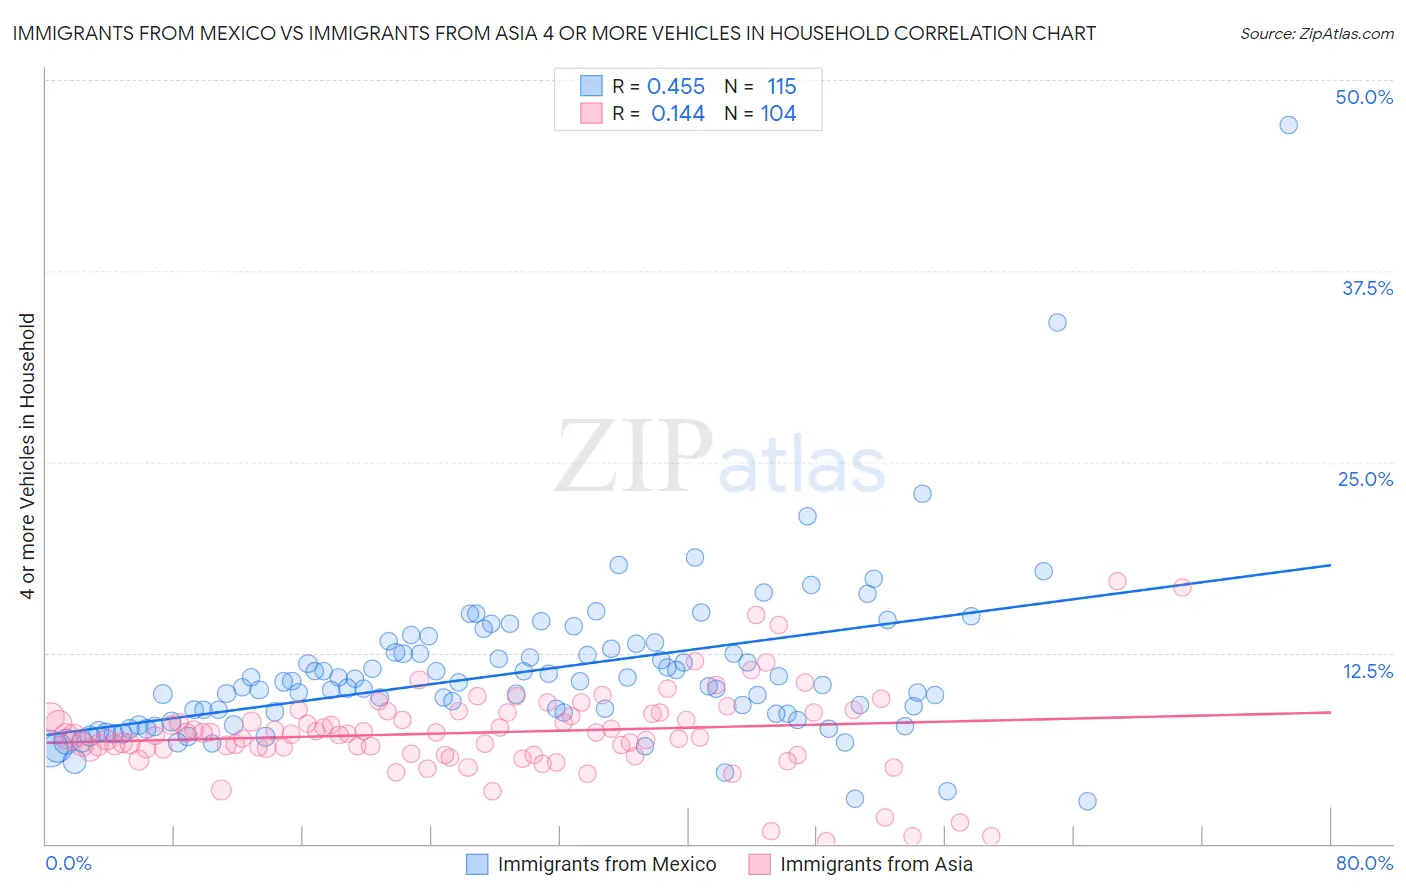
Immigrants from Mexico vs Immigrants from Asia 4 or more Vehicles in Household Correlation Chart
The statistical analysis conducted on geographies consisting of 511,223,450 people shows a moderate positive correlation between the proportion of Immigrants from Mexico and percentage of households with 4 or more vehicles available in the United States with a correlation coefficient (R) of 0.455 and weighted average of 9.0%. Similarly, the statistical analysis conducted on geographies consisting of 545,943,212 people shows a poor positive correlation between the proportion of Immigrants from Asia and percentage of households with 4 or more vehicles available in the United States with a correlation coefficient (R) of 0.144 and weighted average of 6.8%, a difference of 32.8%.
4 or more Vehicles in Household Correlation Summary
| Measurement | Immigrants from Mexico | Immigrants from Asia |
| Minimum | 2.8% | 0.13% |
| Maximum | 47.1% | 17.2% |
| Range | 44.3% | 17.1% |
| Mean | 11.2% | 7.3% |
| Median | 10.3% | 7.2% |
| Interquartile 25% (IQ1) | 8.1% | 6.2% |
| Interquartile 75% (IQ3) | 12.5% | 8.6% |
| Interquartile Range (IQR) | 4.4% | 2.4% |
| Standard Deviation (Sample) | 5.4% | 2.8% |
| Standard Deviation (Population) | 5.3% | 2.8% |
Similar Demographics by 4 or more Vehicles in Household
Demographics Similar to Immigrants from Mexico by 4 or more Vehicles in Household
In terms of 4 or more vehicles in household, the demographic groups most similar to Immigrants from Mexico are Paiute (9.0%, a difference of 0.12%), Mexican (8.9%, a difference of 0.68%), Hawaiian (8.9%, a difference of 0.69%), Chinese (8.8%, a difference of 1.7%), and Shoshone (8.8%, a difference of 1.7%).
| Demographics | Rating | Rank | 4 or more Vehicles in Household |
| Tongans | 100.0 /100 | #4 | Exceptional 10.0% |
| Immigrants | Fiji | 100.0 /100 | #5 | Exceptional 9.6% |
| Puget Sound Salish | 100.0 /100 | #6 | Exceptional 9.4% |
| Native Hawaiians | 100.0 /100 | #7 | Exceptional 9.4% |
| Arapaho | 100.0 /100 | #8 | Exceptional 9.4% |
| Samoans | 100.0 /100 | #9 | Exceptional 9.2% |
| Paiute | 100.0 /100 | #10 | Exceptional 9.0% |
| Immigrants | Mexico | 100.0 /100 | #11 | Exceptional 9.0% |
| Mexicans | 100.0 /100 | #12 | Exceptional 8.9% |
| Hawaiians | 100.0 /100 | #13 | Exceptional 8.9% |
| Chinese | 100.0 /100 | #14 | Exceptional 8.8% |
| Shoshone | 100.0 /100 | #15 | Exceptional 8.8% |
| Lumbee | 100.0 /100 | #16 | Exceptional 8.8% |
| Ute | 100.0 /100 | #17 | Exceptional 8.8% |
| Nepalese | 100.0 /100 | #18 | Exceptional 8.7% |
Demographics Similar to Immigrants from Asia by 4 or more Vehicles in Household
In terms of 4 or more vehicles in household, the demographic groups most similar to Immigrants from Asia are Immigrants (6.8%, a difference of 0.10%), Austrian (6.8%, a difference of 0.10%), Belgian (6.8%, a difference of 0.10%), Immigrants from Germany (6.8%, a difference of 0.16%), and Immigrants from Nicaragua (6.8%, a difference of 0.16%).
| Demographics | Rating | Rank | 4 or more Vehicles in Household |
| Burmese | 95.7 /100 | #117 | Exceptional 6.8% |
| French American Indians | 95.7 /100 | #118 | Exceptional 6.8% |
| Costa Ricans | 95.5 /100 | #119 | Exceptional 6.8% |
| Comanche | 94.8 /100 | #120 | Exceptional 6.8% |
| Immigrants | Germany | 94.7 /100 | #121 | Exceptional 6.8% |
| Immigrants | Nicaragua | 94.7 /100 | #122 | Exceptional 6.8% |
| Immigrants | Immigrants | 94.6 /100 | #123 | Exceptional 6.8% |
| Immigrants | Asia | 94.4 /100 | #124 | Exceptional 6.8% |
| Austrians | 94.1 /100 | #125 | Exceptional 6.8% |
| Belgians | 94.1 /100 | #126 | Exceptional 6.8% |
| Immigrants | Korea | 93.8 /100 | #127 | Exceptional 6.8% |
| Immigrants | Bolivia | 92.5 /100 | #128 | Exceptional 6.7% |
| Immigrants | England | 92.0 /100 | #129 | Exceptional 6.7% |
| Immigrants | Scotland | 89.0 /100 | #130 | Excellent 6.7% |
| Maltese | 88.4 /100 | #131 | Excellent 6.7% |