Latvian vs Immigrants from Asia 4 or more Vehicles in Household
COMPARE
Latvian
Immigrants from Asia
4 or more Vehicles in Household
4 or more Vehicles in Household Comparison
Latvians
Immigrants from Asia
6.1%
4 OR MORE VEHICLES IN HOUSEHOLD
21.7/ 100
METRIC RATING
200th/ 347
METRIC RANK
6.8%
4 OR MORE VEHICLES IN HOUSEHOLD
94.4/ 100
METRIC RATING
124th/ 347
METRIC RANK
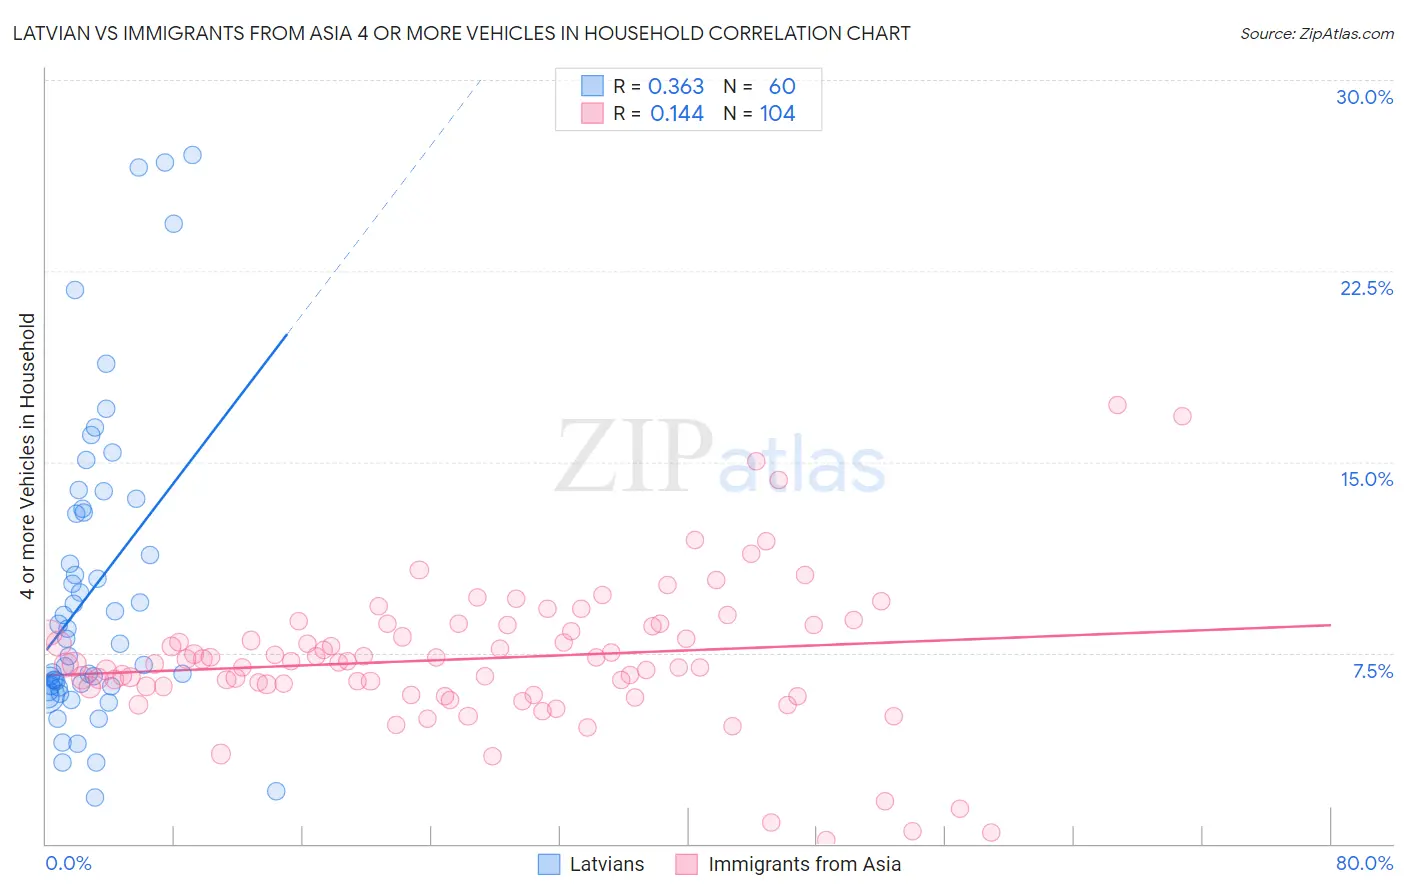
Latvian vs Immigrants from Asia 4 or more Vehicles in Household Correlation Chart
The statistical analysis conducted on geographies consisting of 219,878,436 people shows a mild positive correlation between the proportion of Latvians and percentage of households with 4 or more vehicles available in the United States with a correlation coefficient (R) of 0.363 and weighted average of 6.1%. Similarly, the statistical analysis conducted on geographies consisting of 545,943,212 people shows a poor positive correlation between the proportion of Immigrants from Asia and percentage of households with 4 or more vehicles available in the United States with a correlation coefficient (R) of 0.144 and weighted average of 6.8%, a difference of 10.7%.
4 or more Vehicles in Household Correlation Summary
| Measurement | Latvian | Immigrants from Asia |
| Minimum | 1.8% | 0.13% |
| Maximum | 27.1% | 17.2% |
| Range | 25.3% | 17.1% |
| Mean | 10.0% | 7.3% |
| Median | 8.0% | 7.2% |
| Interquartile 25% (IQ1) | 6.2% | 6.2% |
| Interquartile 75% (IQ3) | 13.1% | 8.6% |
| Interquartile Range (IQR) | 6.9% | 2.4% |
| Standard Deviation (Sample) | 6.1% | 2.8% |
| Standard Deviation (Population) | 6.0% | 2.8% |
Similar Demographics by 4 or more Vehicles in Household
Demographics Similar to Latvians by 4 or more Vehicles in Household
In terms of 4 or more vehicles in household, the demographic groups most similar to Latvians are Immigrants from Norway (6.1%, a difference of 0.0%), Egyptian (6.1%, a difference of 0.050%), Immigrants from South Central Asia (6.1%, a difference of 0.060%), Immigrants from Portugal (6.1%, a difference of 0.090%), and Immigrants from Sierra Leone (6.1%, a difference of 0.20%).
| Demographics | Rating | Rank | 4 or more Vehicles in Household |
| Immigrants | Kuwait | 28.0 /100 | #193 | Fair 6.2% |
| Immigrants | Sweden | 27.0 /100 | #194 | Fair 6.2% |
| Argentineans | 27.0 /100 | #195 | Fair 6.2% |
| Tsimshian | 26.4 /100 | #196 | Fair 6.2% |
| Immigrants | Sri Lanka | 23.7 /100 | #197 | Fair 6.1% |
| Immigrants | Portugal | 22.3 /100 | #198 | Fair 6.1% |
| Immigrants | Norway | 21.8 /100 | #199 | Fair 6.1% |
| Latvians | 21.7 /100 | #200 | Fair 6.1% |
| Egyptians | 21.4 /100 | #201 | Fair 6.1% |
| Immigrants | South Central Asia | 21.3 /100 | #202 | Fair 6.1% |
| Immigrants | Sierra Leone | 20.5 /100 | #203 | Fair 6.1% |
| Immigrants | Belize | 19.8 /100 | #204 | Poor 6.1% |
| Hondurans | 19.3 /100 | #205 | Poor 6.1% |
| Kenyans | 18.5 /100 | #206 | Poor 6.1% |
| Immigrants | Chile | 16.9 /100 | #207 | Poor 6.1% |
Demographics Similar to Immigrants from Asia by 4 or more Vehicles in Household
In terms of 4 or more vehicles in household, the demographic groups most similar to Immigrants from Asia are Immigrants (6.8%, a difference of 0.10%), Austrian (6.8%, a difference of 0.10%), Belgian (6.8%, a difference of 0.10%), Immigrants from Germany (6.8%, a difference of 0.16%), and Immigrants from Nicaragua (6.8%, a difference of 0.16%).
| Demographics | Rating | Rank | 4 or more Vehicles in Household |
| Burmese | 95.7 /100 | #117 | Exceptional 6.8% |
| French American Indians | 95.7 /100 | #118 | Exceptional 6.8% |
| Costa Ricans | 95.5 /100 | #119 | Exceptional 6.8% |
| Comanche | 94.8 /100 | #120 | Exceptional 6.8% |
| Immigrants | Germany | 94.7 /100 | #121 | Exceptional 6.8% |
| Immigrants | Nicaragua | 94.7 /100 | #122 | Exceptional 6.8% |
| Immigrants | Immigrants | 94.6 /100 | #123 | Exceptional 6.8% |
| Immigrants | Asia | 94.4 /100 | #124 | Exceptional 6.8% |
| Austrians | 94.1 /100 | #125 | Exceptional 6.8% |
| Belgians | 94.1 /100 | #126 | Exceptional 6.8% |
| Immigrants | Korea | 93.8 /100 | #127 | Exceptional 6.8% |
| Immigrants | Bolivia | 92.5 /100 | #128 | Exceptional 6.7% |
| Immigrants | England | 92.0 /100 | #129 | Exceptional 6.7% |
| Immigrants | Scotland | 89.0 /100 | #130 | Excellent 6.7% |
| Maltese | 88.4 /100 | #131 | Excellent 6.7% |