Immigrants from Belgium vs Immigrants from Asia 4 or more Vehicles in Household
COMPARE
Immigrants from Belgium
Immigrants from Asia
4 or more Vehicles in Household
4 or more Vehicles in Household Comparison
Immigrants from Belgium
Immigrants from Asia
5.8%
4 OR MORE VEHICLES IN HOUSEHOLD
4.0/ 100
METRIC RATING
238th/ 347
METRIC RANK
6.8%
4 OR MORE VEHICLES IN HOUSEHOLD
94.4/ 100
METRIC RATING
124th/ 347
METRIC RANK
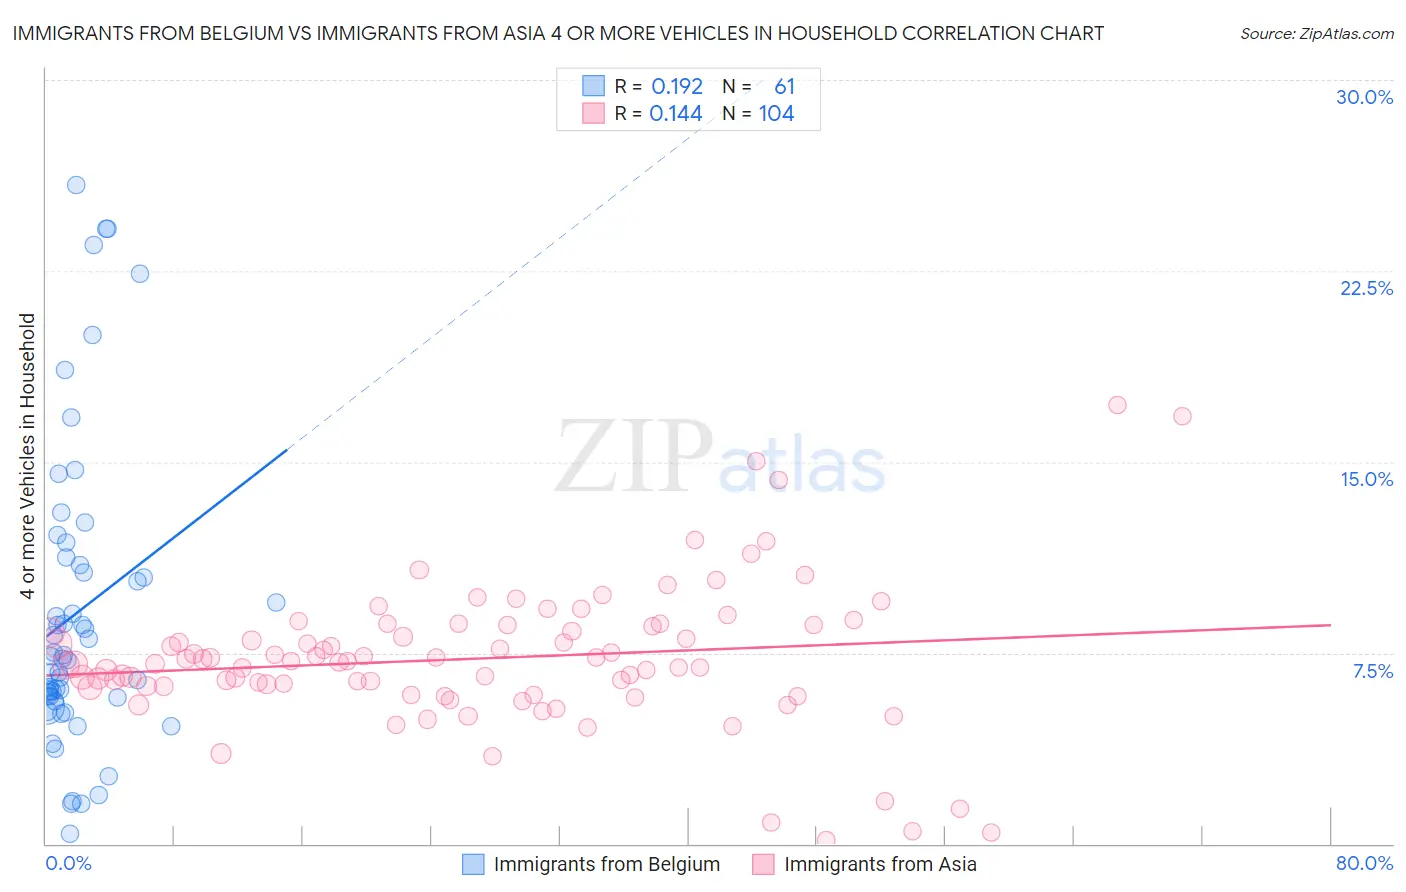
Immigrants from Belgium vs Immigrants from Asia 4 or more Vehicles in Household Correlation Chart
The statistical analysis conducted on geographies consisting of 145,987,799 people shows a poor positive correlation between the proportion of Immigrants from Belgium and percentage of households with 4 or more vehicles available in the United States with a correlation coefficient (R) of 0.192 and weighted average of 5.8%. Similarly, the statistical analysis conducted on geographies consisting of 545,943,212 people shows a poor positive correlation between the proportion of Immigrants from Asia and percentage of households with 4 or more vehicles available in the United States with a correlation coefficient (R) of 0.144 and weighted average of 6.8%, a difference of 16.5%.
4 or more Vehicles in Household Correlation Summary
| Measurement | Immigrants from Belgium | Immigrants from Asia |
| Minimum | 0.41% | 0.13% |
| Maximum | 25.9% | 17.2% |
| Range | 25.5% | 17.1% |
| Mean | 9.1% | 7.3% |
| Median | 7.4% | 7.2% |
| Interquartile 25% (IQ1) | 5.7% | 6.2% |
| Interquartile 75% (IQ3) | 11.1% | 8.6% |
| Interquartile Range (IQR) | 5.4% | 2.4% |
| Standard Deviation (Sample) | 6.0% | 2.8% |
| Standard Deviation (Population) | 5.9% | 2.8% |
Similar Demographics by 4 or more Vehicles in Household
Demographics Similar to Immigrants from Belgium by 4 or more Vehicles in Household
In terms of 4 or more vehicles in household, the demographic groups most similar to Immigrants from Belgium are Immigrants from Australia (5.8%, a difference of 0.090%), Turkish (5.8%, a difference of 0.13%), Immigrants from Poland (5.8%, a difference of 0.13%), Mongolian (5.8%, a difference of 0.23%), and Immigrants from Eritrea (5.8%, a difference of 0.40%).
| Demographics | Rating | Rank | 4 or more Vehicles in Household |
| Immigrants | Switzerland | 6.4 /100 | #231 | Tragic 5.9% |
| Immigrants | Argentina | 6.0 /100 | #232 | Tragic 5.9% |
| Sierra Leoneans | 6.0 /100 | #233 | Tragic 5.9% |
| Africans | 4.6 /100 | #234 | Tragic 5.8% |
| Immigrants | Hungary | 4.6 /100 | #235 | Tragic 5.8% |
| Immigrants | Eritrea | 4.5 /100 | #236 | Tragic 5.8% |
| Turks | 4.1 /100 | #237 | Tragic 5.8% |
| Immigrants | Belgium | 4.0 /100 | #238 | Tragic 5.8% |
| Immigrants | Australia | 3.8 /100 | #239 | Tragic 5.8% |
| Immigrants | Poland | 3.8 /100 | #240 | Tragic 5.8% |
| Mongolians | 3.7 /100 | #241 | Tragic 5.8% |
| Immigrants | Middle Africa | 3.4 /100 | #242 | Tragic 5.8% |
| Immigrants | Czechoslovakia | 3.2 /100 | #243 | Tragic 5.8% |
| Ethiopians | 3.2 /100 | #244 | Tragic 5.8% |
| Bulgarians | 3.1 /100 | #245 | Tragic 5.8% |
Demographics Similar to Immigrants from Asia by 4 or more Vehicles in Household
In terms of 4 or more vehicles in household, the demographic groups most similar to Immigrants from Asia are Immigrants (6.8%, a difference of 0.10%), Austrian (6.8%, a difference of 0.10%), Belgian (6.8%, a difference of 0.10%), Immigrants from Germany (6.8%, a difference of 0.16%), and Immigrants from Nicaragua (6.8%, a difference of 0.16%).
| Demographics | Rating | Rank | 4 or more Vehicles in Household |
| Burmese | 95.7 /100 | #117 | Exceptional 6.8% |
| French American Indians | 95.7 /100 | #118 | Exceptional 6.8% |
| Costa Ricans | 95.5 /100 | #119 | Exceptional 6.8% |
| Comanche | 94.8 /100 | #120 | Exceptional 6.8% |
| Immigrants | Germany | 94.7 /100 | #121 | Exceptional 6.8% |
| Immigrants | Nicaragua | 94.7 /100 | #122 | Exceptional 6.8% |
| Immigrants | Immigrants | 94.6 /100 | #123 | Exceptional 6.8% |
| Immigrants | Asia | 94.4 /100 | #124 | Exceptional 6.8% |
| Austrians | 94.1 /100 | #125 | Exceptional 6.8% |
| Belgians | 94.1 /100 | #126 | Exceptional 6.8% |
| Immigrants | Korea | 93.8 /100 | #127 | Exceptional 6.8% |
| Immigrants | Bolivia | 92.5 /100 | #128 | Exceptional 6.7% |
| Immigrants | England | 92.0 /100 | #129 | Exceptional 6.7% |
| Immigrants | Scotland | 89.0 /100 | #130 | Excellent 6.7% |
| Maltese | 88.4 /100 | #131 | Excellent 6.7% |