Immigrants from Mexico vs Filipino 4 or more Vehicles in Household
COMPARE
Immigrants from Mexico
Filipino
4 or more Vehicles in Household
4 or more Vehicles in Household Comparison
Immigrants from Mexico
Filipinos
9.0%
4 OR MORE VEHICLES IN HOUSEHOLD
100.0/ 100
METRIC RATING
11th/ 347
METRIC RANK
6.9%
4 OR MORE VEHICLES IN HOUSEHOLD
97.6/ 100
METRIC RATING
109th/ 347
METRIC RANK
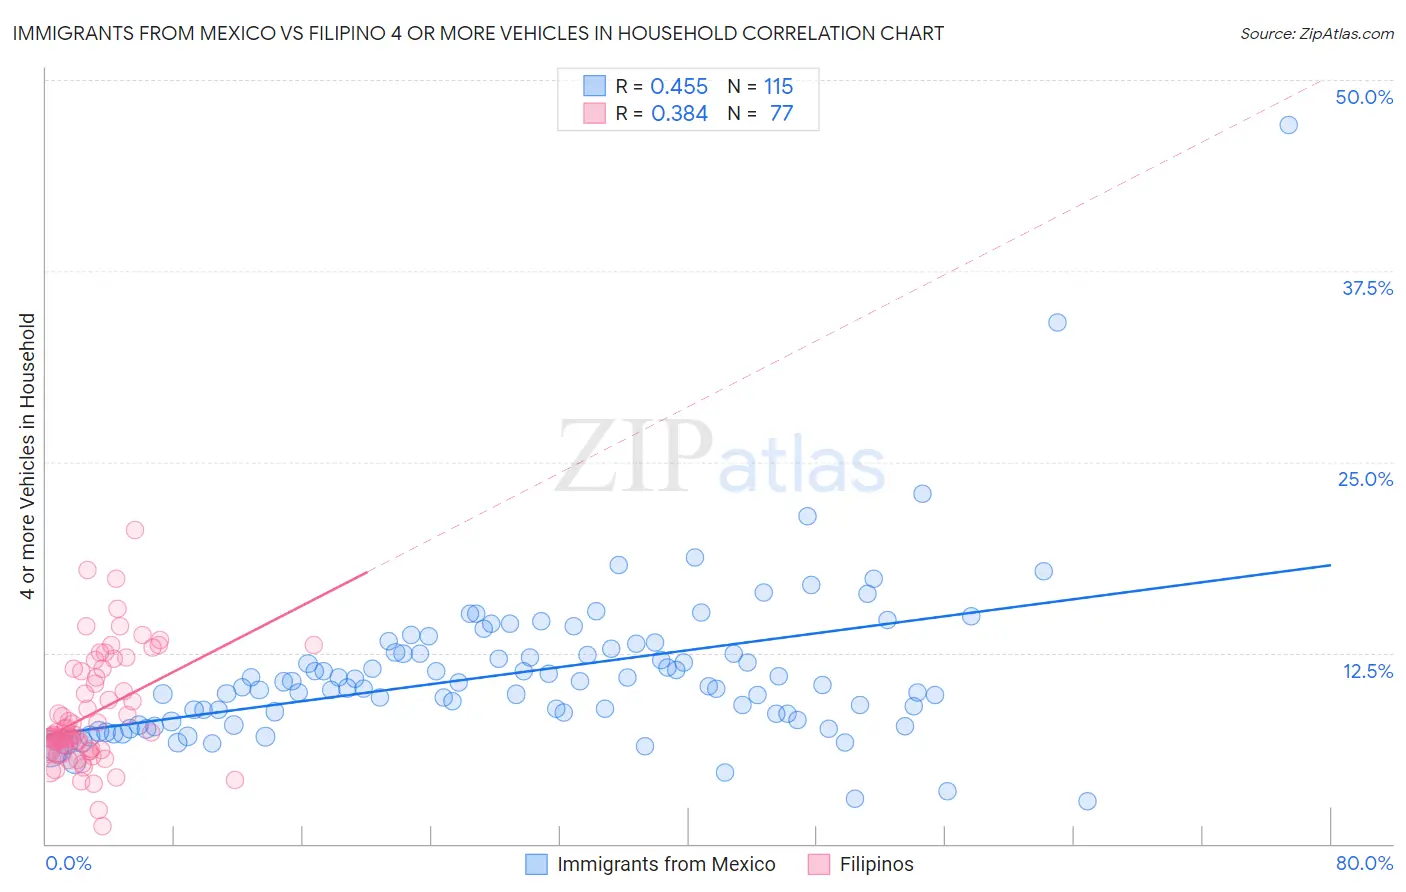
Immigrants from Mexico vs Filipino 4 or more Vehicles in Household Correlation Chart
The statistical analysis conducted on geographies consisting of 511,223,450 people shows a moderate positive correlation between the proportion of Immigrants from Mexico and percentage of households with 4 or more vehicles available in the United States with a correlation coefficient (R) of 0.455 and weighted average of 9.0%. Similarly, the statistical analysis conducted on geographies consisting of 252,798,218 people shows a mild positive correlation between the proportion of Filipinos and percentage of households with 4 or more vehicles available in the United States with a correlation coefficient (R) of 0.384 and weighted average of 6.9%, a difference of 30.1%.
4 or more Vehicles in Household Correlation Summary
| Measurement | Immigrants from Mexico | Filipino |
| Minimum | 2.8% | 1.2% |
| Maximum | 47.1% | 20.6% |
| Range | 44.3% | 19.4% |
| Mean | 11.2% | 8.5% |
| Median | 10.3% | 7.1% |
| Interquartile 25% (IQ1) | 8.1% | 6.1% |
| Interquartile 75% (IQ3) | 12.5% | 11.4% |
| Interquartile Range (IQR) | 4.4% | 5.2% |
| Standard Deviation (Sample) | 5.4% | 3.7% |
| Standard Deviation (Population) | 5.3% | 3.7% |
Similar Demographics by 4 or more Vehicles in Household
Demographics Similar to Immigrants from Mexico by 4 or more Vehicles in Household
In terms of 4 or more vehicles in household, the demographic groups most similar to Immigrants from Mexico are Paiute (9.0%, a difference of 0.12%), Mexican (8.9%, a difference of 0.68%), Hawaiian (8.9%, a difference of 0.69%), Chinese (8.8%, a difference of 1.7%), and Shoshone (8.8%, a difference of 1.7%).
| Demographics | Rating | Rank | 4 or more Vehicles in Household |
| Tongans | 100.0 /100 | #4 | Exceptional 10.0% |
| Immigrants | Fiji | 100.0 /100 | #5 | Exceptional 9.6% |
| Puget Sound Salish | 100.0 /100 | #6 | Exceptional 9.4% |
| Native Hawaiians | 100.0 /100 | #7 | Exceptional 9.4% |
| Arapaho | 100.0 /100 | #8 | Exceptional 9.4% |
| Samoans | 100.0 /100 | #9 | Exceptional 9.2% |
| Paiute | 100.0 /100 | #10 | Exceptional 9.0% |
| Immigrants | Mexico | 100.0 /100 | #11 | Exceptional 9.0% |
| Mexicans | 100.0 /100 | #12 | Exceptional 8.9% |
| Hawaiians | 100.0 /100 | #13 | Exceptional 8.9% |
| Chinese | 100.0 /100 | #14 | Exceptional 8.8% |
| Shoshone | 100.0 /100 | #15 | Exceptional 8.8% |
| Lumbee | 100.0 /100 | #16 | Exceptional 8.8% |
| Ute | 100.0 /100 | #17 | Exceptional 8.8% |
| Nepalese | 100.0 /100 | #18 | Exceptional 8.7% |
Demographics Similar to Filipinos by 4 or more Vehicles in Household
In terms of 4 or more vehicles in household, the demographic groups most similar to Filipinos are French (6.9%, a difference of 0.18%), Immigrants from Thailand (6.9%, a difference of 0.50%), Nicaraguan (7.0%, a difference of 0.52%), Guatemalan (7.0%, a difference of 0.53%), and Aleut (6.9%, a difference of 0.53%).
| Demographics | Rating | Rank | 4 or more Vehicles in Household |
| Asians | 98.6 /100 | #102 | Exceptional 7.0% |
| Blackfeet | 98.6 /100 | #103 | Exceptional 7.0% |
| Hmong | 98.3 /100 | #104 | Exceptional 7.0% |
| German Russians | 98.3 /100 | #105 | Exceptional 7.0% |
| Guatemalans | 98.1 /100 | #106 | Exceptional 7.0% |
| Nicaraguans | 98.0 /100 | #107 | Exceptional 7.0% |
| French | 97.7 /100 | #108 | Exceptional 6.9% |
| Filipinos | 97.6 /100 | #109 | Exceptional 6.9% |
| Immigrants | Thailand | 97.0 /100 | #110 | Exceptional 6.9% |
| Aleuts | 97.0 /100 | #111 | Exceptional 6.9% |
| Hopi | 97.0 /100 | #112 | Exceptional 6.9% |
| Canadians | 96.4 /100 | #113 | Exceptional 6.9% |
| Bolivians | 96.3 /100 | #114 | Exceptional 6.8% |
| Tlingit-Haida | 96.2 /100 | #115 | Exceptional 6.8% |
| Immigrants | Guatemala | 95.8 /100 | #116 | Exceptional 6.8% |