Immigrants from Mexico vs Bulgarian 4 or more Vehicles in Household
COMPARE
Immigrants from Mexico
Bulgarian
4 or more Vehicles in Household
4 or more Vehicles in Household Comparison
Immigrants from Mexico
Bulgarians
9.0%
4 OR MORE VEHICLES IN HOUSEHOLD
100.0/ 100
METRIC RATING
11th/ 347
METRIC RANK
5.8%
4 OR MORE VEHICLES IN HOUSEHOLD
3.1/ 100
METRIC RATING
245th/ 347
METRIC RANK
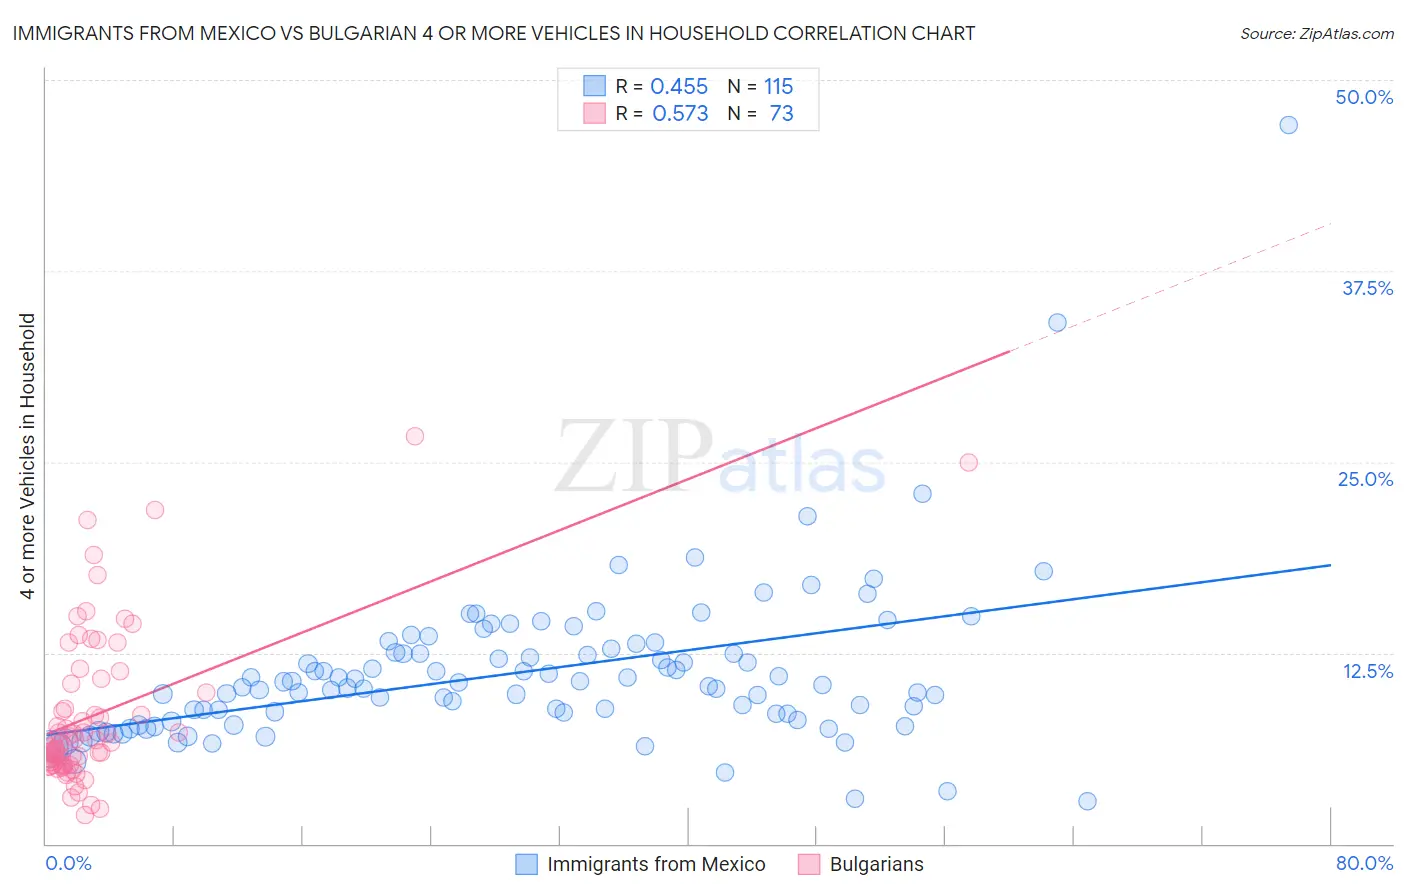
Immigrants from Mexico vs Bulgarian 4 or more Vehicles in Household Correlation Chart
The statistical analysis conducted on geographies consisting of 511,223,450 people shows a moderate positive correlation between the proportion of Immigrants from Mexico and percentage of households with 4 or more vehicles available in the United States with a correlation coefficient (R) of 0.455 and weighted average of 9.0%. Similarly, the statistical analysis conducted on geographies consisting of 205,001,744 people shows a substantial positive correlation between the proportion of Bulgarians and percentage of households with 4 or more vehicles available in the United States with a correlation coefficient (R) of 0.573 and weighted average of 5.8%, a difference of 55.8%.
4 or more Vehicles in Household Correlation Summary
| Measurement | Immigrants from Mexico | Bulgarian |
| Minimum | 2.8% | 1.9% |
| Maximum | 47.1% | 26.7% |
| Range | 44.3% | 24.8% |
| Mean | 11.2% | 8.5% |
| Median | 10.3% | 6.7% |
| Interquartile 25% (IQ1) | 8.1% | 5.2% |
| Interquartile 75% (IQ3) | 12.5% | 10.6% |
| Interquartile Range (IQR) | 4.4% | 5.5% |
| Standard Deviation (Sample) | 5.4% | 5.2% |
| Standard Deviation (Population) | 5.3% | 5.2% |
Similar Demographics by 4 or more Vehicles in Household
Demographics Similar to Immigrants from Mexico by 4 or more Vehicles in Household
In terms of 4 or more vehicles in household, the demographic groups most similar to Immigrants from Mexico are Paiute (9.0%, a difference of 0.12%), Mexican (8.9%, a difference of 0.68%), Hawaiian (8.9%, a difference of 0.69%), Chinese (8.8%, a difference of 1.7%), and Shoshone (8.8%, a difference of 1.7%).
| Demographics | Rating | Rank | 4 or more Vehicles in Household |
| Tongans | 100.0 /100 | #4 | Exceptional 10.0% |
| Immigrants | Fiji | 100.0 /100 | #5 | Exceptional 9.6% |
| Puget Sound Salish | 100.0 /100 | #6 | Exceptional 9.4% |
| Native Hawaiians | 100.0 /100 | #7 | Exceptional 9.4% |
| Arapaho | 100.0 /100 | #8 | Exceptional 9.4% |
| Samoans | 100.0 /100 | #9 | Exceptional 9.2% |
| Paiute | 100.0 /100 | #10 | Exceptional 9.0% |
| Immigrants | Mexico | 100.0 /100 | #11 | Exceptional 9.0% |
| Mexicans | 100.0 /100 | #12 | Exceptional 8.9% |
| Hawaiians | 100.0 /100 | #13 | Exceptional 8.9% |
| Chinese | 100.0 /100 | #14 | Exceptional 8.8% |
| Shoshone | 100.0 /100 | #15 | Exceptional 8.8% |
| Lumbee | 100.0 /100 | #16 | Exceptional 8.8% |
| Ute | 100.0 /100 | #17 | Exceptional 8.8% |
| Nepalese | 100.0 /100 | #18 | Exceptional 8.7% |
Demographics Similar to Bulgarians by 4 or more Vehicles in Household
In terms of 4 or more vehicles in household, the demographic groups most similar to Bulgarians are Ethiopian (5.8%, a difference of 0.040%), Immigrants from Czechoslovakia (5.8%, a difference of 0.050%), Immigrants from Middle Africa (5.8%, a difference of 0.24%), Mongolian (5.8%, a difference of 0.45%), and Immigrants from Poland (5.8%, a difference of 0.54%).
| Demographics | Rating | Rank | 4 or more Vehicles in Household |
| Immigrants | Belgium | 4.0 /100 | #238 | Tragic 5.8% |
| Immigrants | Australia | 3.8 /100 | #239 | Tragic 5.8% |
| Immigrants | Poland | 3.8 /100 | #240 | Tragic 5.8% |
| Mongolians | 3.7 /100 | #241 | Tragic 5.8% |
| Immigrants | Middle Africa | 3.4 /100 | #242 | Tragic 5.8% |
| Immigrants | Czechoslovakia | 3.2 /100 | #243 | Tragic 5.8% |
| Ethiopians | 3.2 /100 | #244 | Tragic 5.8% |
| Bulgarians | 3.1 /100 | #245 | Tragic 5.8% |
| Immigrants | North Macedonia | 2.5 /100 | #246 | Tragic 5.7% |
| Immigrants | Ethiopia | 2.4 /100 | #247 | Tragic 5.7% |
| Immigrants | Eastern Africa | 2.4 /100 | #248 | Tragic 5.7% |
| Immigrants | Southern Europe | 2.3 /100 | #249 | Tragic 5.7% |
| Immigrants | Europe | 2.3 /100 | #250 | Tragic 5.7% |
| Ugandans | 2.2 /100 | #251 | Tragic 5.7% |
| Sub-Saharan Africans | 2.1 /100 | #252 | Tragic 5.7% |