Cypriot vs Laotian 4 or more Vehicles in Household
COMPARE
Cypriot
Laotian
4 or more Vehicles in Household
4 or more Vehicles in Household Comparison
Cypriots
Laotians
5.0%
4 OR MORE VEHICLES IN HOUSEHOLD
0.0/ 100
METRIC RATING
304th/ 347
METRIC RANK
7.4%
4 OR MORE VEHICLES IN HOUSEHOLD
99.9/ 100
METRIC RATING
76th/ 347
METRIC RANK
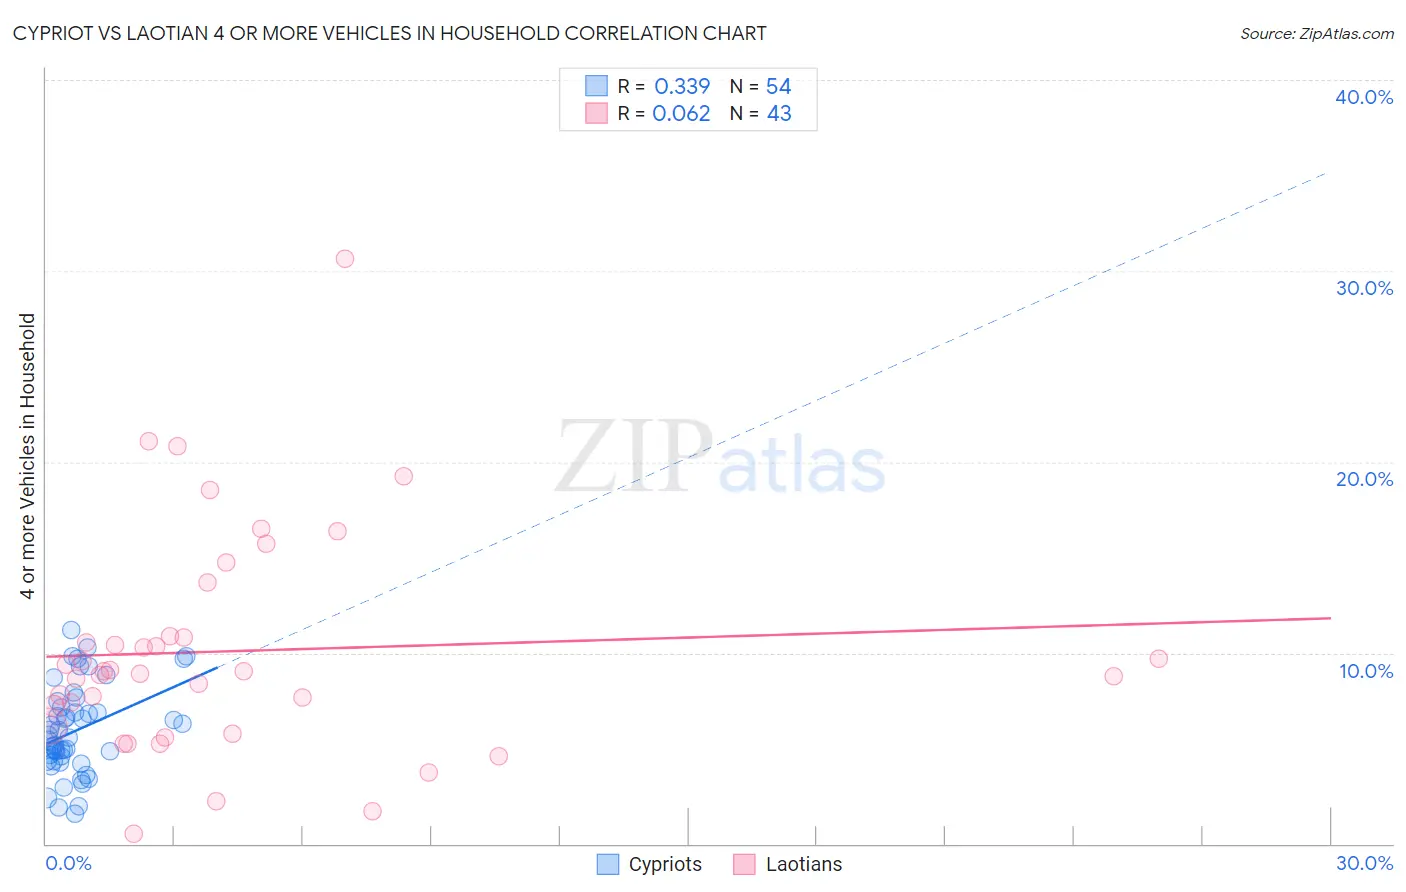
Cypriot vs Laotian 4 or more Vehicles in Household Correlation Chart
The statistical analysis conducted on geographies consisting of 61,625,264 people shows a mild positive correlation between the proportion of Cypriots and percentage of households with 4 or more vehicles available in the United States with a correlation coefficient (R) of 0.339 and weighted average of 5.0%. Similarly, the statistical analysis conducted on geographies consisting of 224,004,331 people shows a slight positive correlation between the proportion of Laotians and percentage of households with 4 or more vehicles available in the United States with a correlation coefficient (R) of 0.062 and weighted average of 7.4%, a difference of 46.9%.
4 or more Vehicles in Household Correlation Summary
| Measurement | Cypriot | Laotian |
| Minimum | 1.6% | 0.54% |
| Maximum | 11.2% | 30.6% |
| Range | 9.6% | 30.1% |
| Mean | 5.9% | 10.1% |
| Median | 5.6% | 9.0% |
| Interquartile 25% (IQ1) | 4.4% | 6.1% |
| Interquartile 75% (IQ3) | 7.1% | 10.8% |
| Interquartile Range (IQR) | 2.7% | 4.7% |
| Standard Deviation (Sample) | 2.3% | 5.8% |
| Standard Deviation (Population) | 2.3% | 5.8% |
Similar Demographics by 4 or more Vehicles in Household
Demographics Similar to Cypriots by 4 or more Vehicles in Household
In terms of 4 or more vehicles in household, the demographic groups most similar to Cypriots are Somali (5.0%, a difference of 0.0%), Immigrants from Serbia (5.0%, a difference of 0.090%), Immigrants from Greece (5.1%, a difference of 0.55%), Bahamian (5.1%, a difference of 1.0%), and Menominee (5.0%, a difference of 1.0%).
| Demographics | Rating | Rank | 4 or more Vehicles in Household |
| Immigrants | Venezuela | 0.1 /100 | #297 | Tragic 5.2% |
| Immigrants | South America | 0.1 /100 | #298 | Tragic 5.2% |
| Immigrants | Ghana | 0.1 /100 | #299 | Tragic 5.2% |
| Immigrants | Morocco | 0.0 /100 | #300 | Tragic 5.1% |
| Immigrants | Zaire | 0.0 /100 | #301 | Tragic 5.1% |
| Bahamians | 0.0 /100 | #302 | Tragic 5.1% |
| Immigrants | Greece | 0.0 /100 | #303 | Tragic 5.1% |
| Cypriots | 0.0 /100 | #304 | Tragic 5.0% |
| Somalis | 0.0 /100 | #305 | Tragic 5.0% |
| Immigrants | Serbia | 0.0 /100 | #306 | Tragic 5.0% |
| Menominee | 0.0 /100 | #307 | Tragic 5.0% |
| Paraguayans | 0.0 /100 | #308 | Tragic 4.9% |
| Immigrants | Somalia | 0.0 /100 | #309 | Tragic 4.9% |
| Moroccans | 0.0 /100 | #310 | Tragic 4.9% |
| Houma | 0.0 /100 | #311 | Tragic 4.9% |
Demographics Similar to Laotians by 4 or more Vehicles in Household
In terms of 4 or more vehicles in household, the demographic groups most similar to Laotians are Icelander (7.4%, a difference of 0.050%), Immigrants from Cambodia (7.4%, a difference of 0.050%), Apache (7.4%, a difference of 0.17%), White/Caucasian (7.4%, a difference of 0.23%), and Portuguese (7.4%, a difference of 0.36%).
| Demographics | Rating | Rank | 4 or more Vehicles in Household |
| Germans | 99.9 /100 | #69 | Exceptional 7.5% |
| Scottish | 99.9 /100 | #70 | Exceptional 7.4% |
| Chickasaw | 99.9 /100 | #71 | Exceptional 7.4% |
| Scotch-Irish | 99.9 /100 | #72 | Exceptional 7.4% |
| Portuguese | 99.9 /100 | #73 | Exceptional 7.4% |
| Icelanders | 99.9 /100 | #74 | Exceptional 7.4% |
| Immigrants | Cambodia | 99.9 /100 | #75 | Exceptional 7.4% |
| Laotians | 99.9 /100 | #76 | Exceptional 7.4% |
| Apache | 99.9 /100 | #77 | Exceptional 7.4% |
| Whites/Caucasians | 99.8 /100 | #78 | Exceptional 7.4% |
| Czechs | 99.8 /100 | #79 | Exceptional 7.4% |
| Alaska Natives | 99.8 /100 | #80 | Exceptional 7.3% |
| Finns | 99.8 /100 | #81 | Exceptional 7.3% |
| Northern Europeans | 99.8 /100 | #82 | Exceptional 7.3% |
| Potawatomi | 99.7 /100 | #83 | Exceptional 7.3% |