Immigrants from Korea vs Immigrants from China 1 or more Vehicles in Household
COMPARE
Immigrants from Korea
Immigrants from China
1 or more Vehicles in Household
1 or more Vehicles in Household Comparison
Immigrants from Korea
Immigrants from China
90.5%
1 OR MORE VEHICLES IN HOUSEHOLD
90.5/ 100
METRIC RATING
125th/ 347
METRIC RANK
84.9%
1 OR MORE VEHICLES IN HOUSEHOLD
0.0/ 100
METRIC RATING
305th/ 347
METRIC RANK
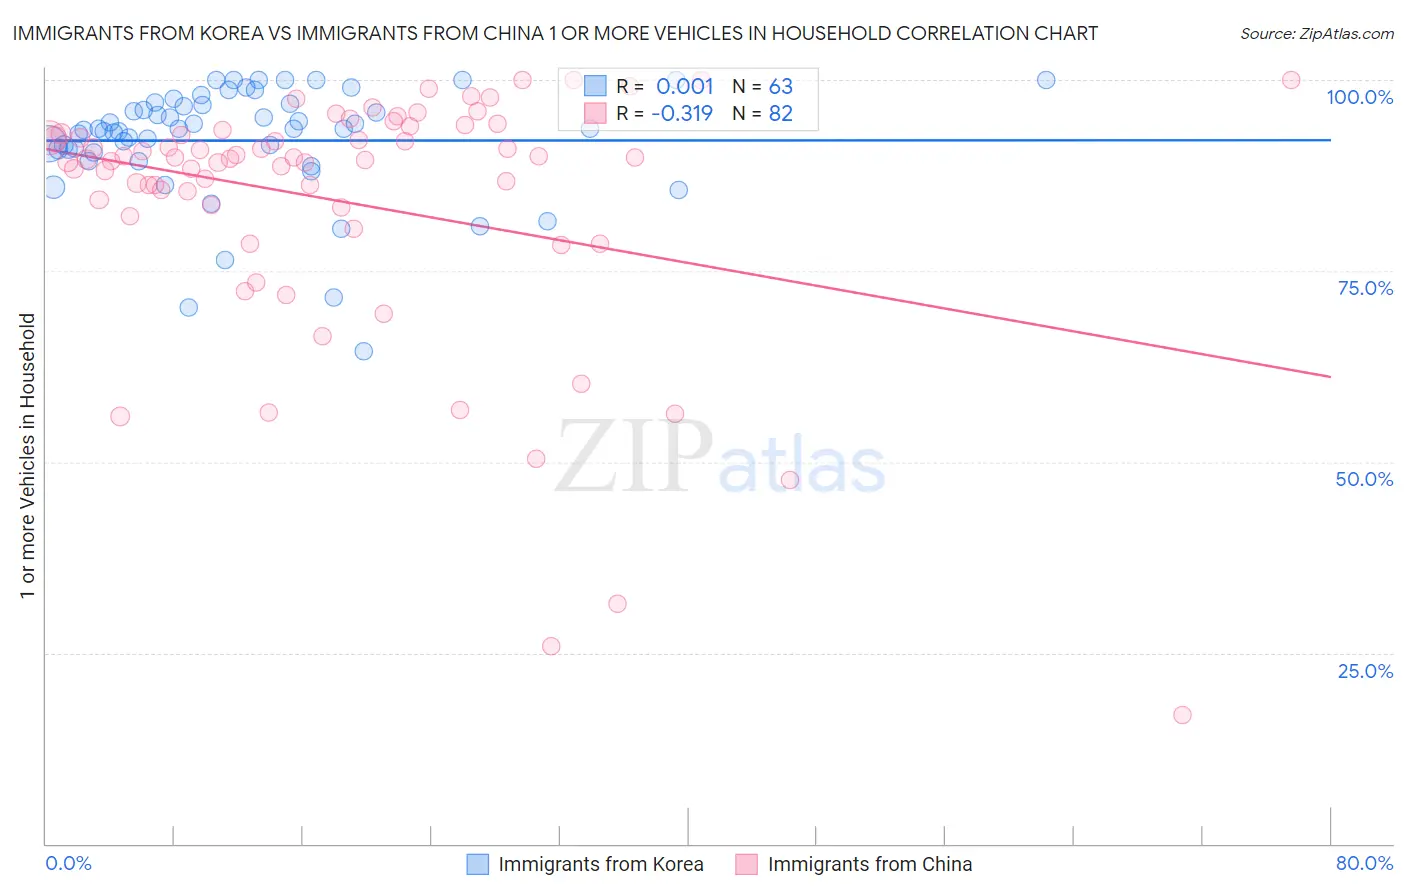
Immigrants from Korea vs Immigrants from China 1 or more Vehicles in Household Correlation Chart
The statistical analysis conducted on geographies consisting of 416,017,081 people shows no correlation between the proportion of Immigrants from Korea and percentage of households with 1 or more vehicles available in the United States with a correlation coefficient (R) of 0.001 and weighted average of 90.5%. Similarly, the statistical analysis conducted on geographies consisting of 456,603,328 people shows a mild negative correlation between the proportion of Immigrants from China and percentage of households with 1 or more vehicles available in the United States with a correlation coefficient (R) of -0.319 and weighted average of 84.9%, a difference of 6.5%.
1 or more Vehicles in Household Correlation Summary
| Measurement | Immigrants from Korea | Immigrants from China |
| Minimum | 64.5% | 16.8% |
| Maximum | 100.0% | 100.0% |
| Range | 35.5% | 83.2% |
| Mean | 92.1% | 84.0% |
| Median | 93.6% | 89.7% |
| Interquartile 25% (IQ1) | 90.5% | 83.3% |
| Interquartile 75% (IQ3) | 97.0% | 92.9% |
| Interquartile Range (IQR) | 6.5% | 9.6% |
| Standard Deviation (Sample) | 7.5% | 16.7% |
| Standard Deviation (Population) | 7.4% | 16.6% |
Similar Demographics by 1 or more Vehicles in Household
Demographics Similar to Immigrants from Korea by 1 or more Vehicles in Household
In terms of 1 or more vehicles in household, the demographic groups most similar to Immigrants from Korea are Puget Sound Salish (90.5%, a difference of 0.040%), Immigrants from Cameroon (90.4%, a difference of 0.050%), Fijian (90.5%, a difference of 0.060%), Immigrants from the Azores (90.4%, a difference of 0.060%), and Burmese (90.4%, a difference of 0.060%).
| Demographics | Rating | Rank | 1 or more Vehicles in Household |
| Japanese | 93.4 /100 | #118 | Exceptional 90.6% |
| Blackfeet | 92.6 /100 | #119 | Exceptional 90.6% |
| Immigrants | Thailand | 92.3 /100 | #120 | Exceptional 90.6% |
| Icelanders | 92.1 /100 | #121 | Exceptional 90.5% |
| Costa Ricans | 92.0 /100 | #122 | Exceptional 90.5% |
| Fijians | 91.8 /100 | #123 | Exceptional 90.5% |
| Puget Sound Salish | 91.5 /100 | #124 | Exceptional 90.5% |
| Immigrants | Korea | 90.5 /100 | #125 | Exceptional 90.5% |
| Immigrants | Cameroon | 89.4 /100 | #126 | Excellent 90.4% |
| Immigrants | Azores | 89.1 /100 | #127 | Excellent 90.4% |
| Burmese | 89.0 /100 | #128 | Excellent 90.4% |
| Marshallese | 88.9 /100 | #129 | Excellent 90.4% |
| Nicaraguans | 88.8 /100 | #130 | Excellent 90.4% |
| Immigrants | Kenya | 88.5 /100 | #131 | Excellent 90.4% |
| Immigrants | South Africa | 88.1 /100 | #132 | Excellent 90.4% |
Demographics Similar to Immigrants from China by 1 or more Vehicles in Household
In terms of 1 or more vehicles in household, the demographic groups most similar to Immigrants from China are Immigrants from Western Africa (84.9%, a difference of 0.020%), Tohono O'odham (84.7%, a difference of 0.28%), Immigrants from Belize (84.7%, a difference of 0.31%), Immigrants from Haiti (84.7%, a difference of 0.32%), and Immigrants from Ukraine (85.2%, a difference of 0.34%).
| Demographics | Rating | Rank | 1 or more Vehicles in Household |
| Belizeans | 0.0 /100 | #298 | Tragic 85.7% |
| Yuman | 0.0 /100 | #299 | Tragic 85.5% |
| Immigrants | Russia | 0.0 /100 | #300 | Tragic 85.4% |
| Immigrants | Panama | 0.0 /100 | #301 | Tragic 85.4% |
| Moroccans | 0.0 /100 | #302 | Tragic 85.4% |
| Immigrants | Greece | 0.0 /100 | #303 | Tragic 85.4% |
| Immigrants | Ukraine | 0.0 /100 | #304 | Tragic 85.2% |
| Immigrants | China | 0.0 /100 | #305 | Tragic 84.9% |
| Immigrants | Western Africa | 0.0 /100 | #306 | Tragic 84.9% |
| Tohono O'odham | 0.0 /100 | #307 | Tragic 84.7% |
| Immigrants | Belize | 0.0 /100 | #308 | Tragic 84.7% |
| Immigrants | Haiti | 0.0 /100 | #309 | Tragic 84.7% |
| U.S. Virgin Islanders | 0.0 /100 | #310 | Tragic 84.6% |
| Puerto Ricans | 0.0 /100 | #311 | Tragic 84.6% |
| Cape Verdeans | 0.0 /100 | #312 | Tragic 84.5% |