Immigrants from Korea vs Indian (Asian) 1 or more Vehicles in Household
COMPARE
Immigrants from Korea
Indian (Asian)
1 or more Vehicles in Household
1 or more Vehicles in Household Comparison
Immigrants from Korea
Indians (Asian)
90.5%
1 OR MORE VEHICLES IN HOUSEHOLD
90.5/ 100
METRIC RATING
125th/ 347
METRIC RANK
86.0%
1 OR MORE VEHICLES IN HOUSEHOLD
0.0/ 100
METRIC RATING
293rd/ 347
METRIC RANK
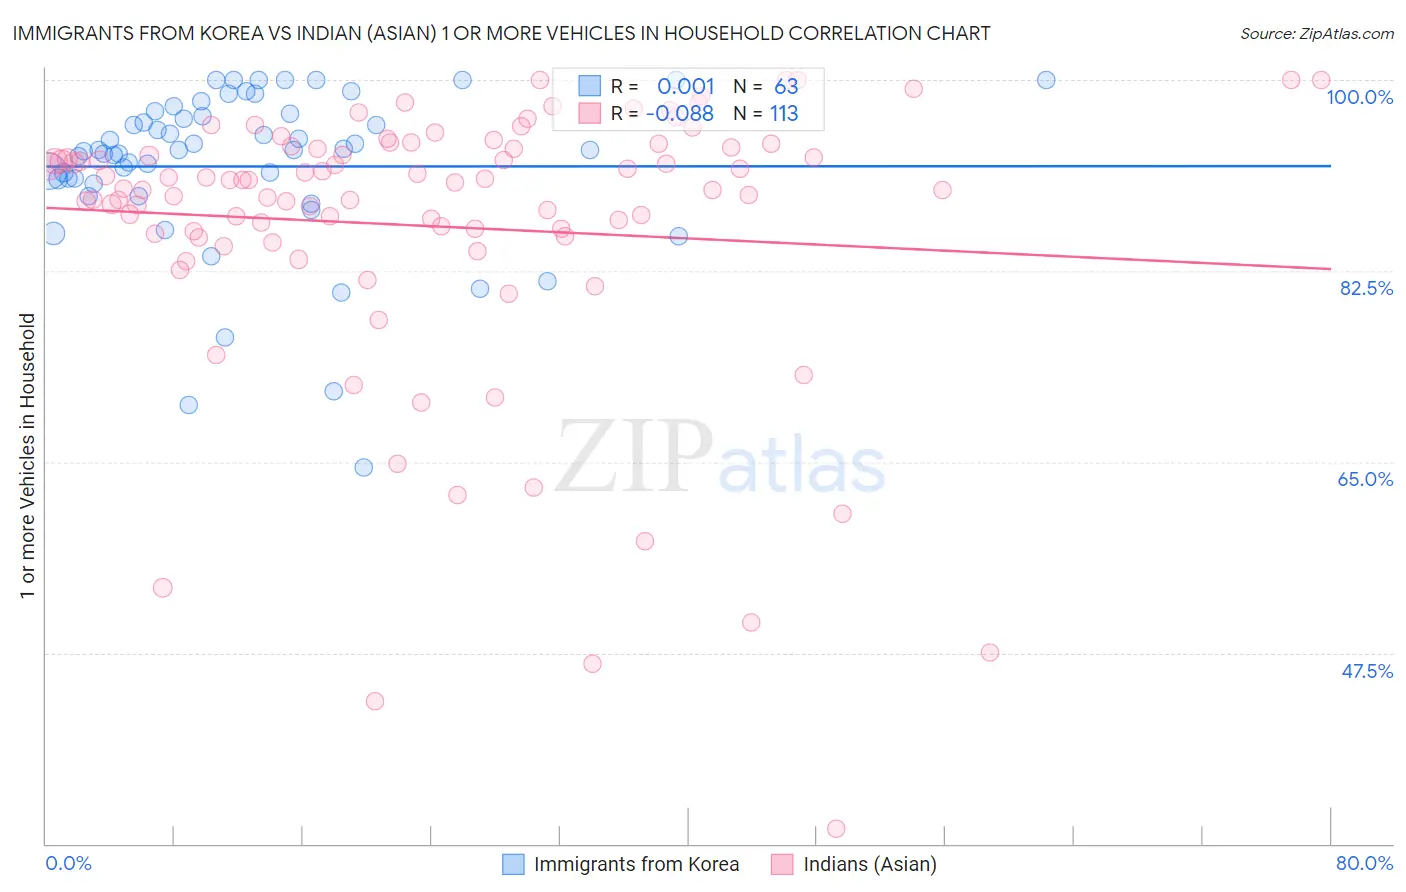
Immigrants from Korea vs Indian (Asian) 1 or more Vehicles in Household Correlation Chart
The statistical analysis conducted on geographies consisting of 416,017,081 people shows no correlation between the proportion of Immigrants from Korea and percentage of households with 1 or more vehicles available in the United States with a correlation coefficient (R) of 0.001 and weighted average of 90.5%. Similarly, the statistical analysis conducted on geographies consisting of 494,856,694 people shows a slight negative correlation between the proportion of Indians (Asian) and percentage of households with 1 or more vehicles available in the United States with a correlation coefficient (R) of -0.088 and weighted average of 86.0%, a difference of 5.2%.
1 or more Vehicles in Household Correlation Summary
| Measurement | Immigrants from Korea | Indian (Asian) |
| Minimum | 64.5% | 31.4% |
| Maximum | 100.0% | 100.0% |
| Range | 35.5% | 68.6% |
| Mean | 92.1% | 86.6% |
| Median | 93.6% | 90.6% |
| Interquartile 25% (IQ1) | 90.5% | 85.8% |
| Interquartile 75% (IQ3) | 97.0% | 93.9% |
| Interquartile Range (IQR) | 6.5% | 8.1% |
| Standard Deviation (Sample) | 7.5% | 13.0% |
| Standard Deviation (Population) | 7.4% | 13.0% |
Similar Demographics by 1 or more Vehicles in Household
Demographics Similar to Immigrants from Korea by 1 or more Vehicles in Household
In terms of 1 or more vehicles in household, the demographic groups most similar to Immigrants from Korea are Puget Sound Salish (90.5%, a difference of 0.040%), Immigrants from Cameroon (90.4%, a difference of 0.050%), Fijian (90.5%, a difference of 0.060%), Immigrants from the Azores (90.4%, a difference of 0.060%), and Burmese (90.4%, a difference of 0.060%).
| Demographics | Rating | Rank | 1 or more Vehicles in Household |
| Japanese | 93.4 /100 | #118 | Exceptional 90.6% |
| Blackfeet | 92.6 /100 | #119 | Exceptional 90.6% |
| Immigrants | Thailand | 92.3 /100 | #120 | Exceptional 90.6% |
| Icelanders | 92.1 /100 | #121 | Exceptional 90.5% |
| Costa Ricans | 92.0 /100 | #122 | Exceptional 90.5% |
| Fijians | 91.8 /100 | #123 | Exceptional 90.5% |
| Puget Sound Salish | 91.5 /100 | #124 | Exceptional 90.5% |
| Immigrants | Korea | 90.5 /100 | #125 | Exceptional 90.5% |
| Immigrants | Cameroon | 89.4 /100 | #126 | Excellent 90.4% |
| Immigrants | Azores | 89.1 /100 | #127 | Excellent 90.4% |
| Burmese | 89.0 /100 | #128 | Excellent 90.4% |
| Marshallese | 88.9 /100 | #129 | Excellent 90.4% |
| Nicaraguans | 88.8 /100 | #130 | Excellent 90.4% |
| Immigrants | Kenya | 88.5 /100 | #131 | Excellent 90.4% |
| Immigrants | South Africa | 88.1 /100 | #132 | Excellent 90.4% |
Demographics Similar to Indians (Asian) by 1 or more Vehicles in Household
In terms of 1 or more vehicles in household, the demographic groups most similar to Indians (Asian) are Okinawan (86.1%, a difference of 0.060%), Alaskan Athabascan (86.0%, a difference of 0.070%), Immigrants from Jamaica (85.8%, a difference of 0.24%), Immigrants from Spain (85.8%, a difference of 0.28%), and Pima (86.3%, a difference of 0.29%).
| Demographics | Rating | Rank | 1 or more Vehicles in Household |
| Immigrants | Eastern Asia | 0.0 /100 | #286 | Tragic 86.5% |
| Immigrants | Malaysia | 0.0 /100 | #287 | Tragic 86.5% |
| Hopi | 0.0 /100 | #288 | Tragic 86.4% |
| Immigrants | Ireland | 0.0 /100 | #289 | Tragic 86.4% |
| Immigrants | Australia | 0.0 /100 | #290 | Tragic 86.4% |
| Pima | 0.0 /100 | #291 | Tragic 86.3% |
| Okinawans | 0.0 /100 | #292 | Tragic 86.1% |
| Indians (Asian) | 0.0 /100 | #293 | Tragic 86.0% |
| Alaskan Athabascans | 0.0 /100 | #294 | Tragic 86.0% |
| Immigrants | Jamaica | 0.0 /100 | #295 | Tragic 85.8% |
| Immigrants | Spain | 0.0 /100 | #296 | Tragic 85.8% |
| Paraguayans | 0.0 /100 | #297 | Tragic 85.7% |
| Belizeans | 0.0 /100 | #298 | Tragic 85.7% |
| Yuman | 0.0 /100 | #299 | Tragic 85.5% |
| Immigrants | Russia | 0.0 /100 | #300 | Tragic 85.4% |