Immigrants from Korea vs Native/Alaskan 1 or more Vehicles in Household
COMPARE
Immigrants from Korea
Native/Alaskan
1 or more Vehicles in Household
1 or more Vehicles in Household Comparison
Immigrants from Korea
Natives/Alaskans
90.5%
1 OR MORE VEHICLES IN HOUSEHOLD
90.5/ 100
METRIC RATING
125th/ 347
METRIC RANK
89.8%
1 OR MORE VEHICLES IN HOUSEHOLD
59.5/ 100
METRIC RATING
169th/ 347
METRIC RANK
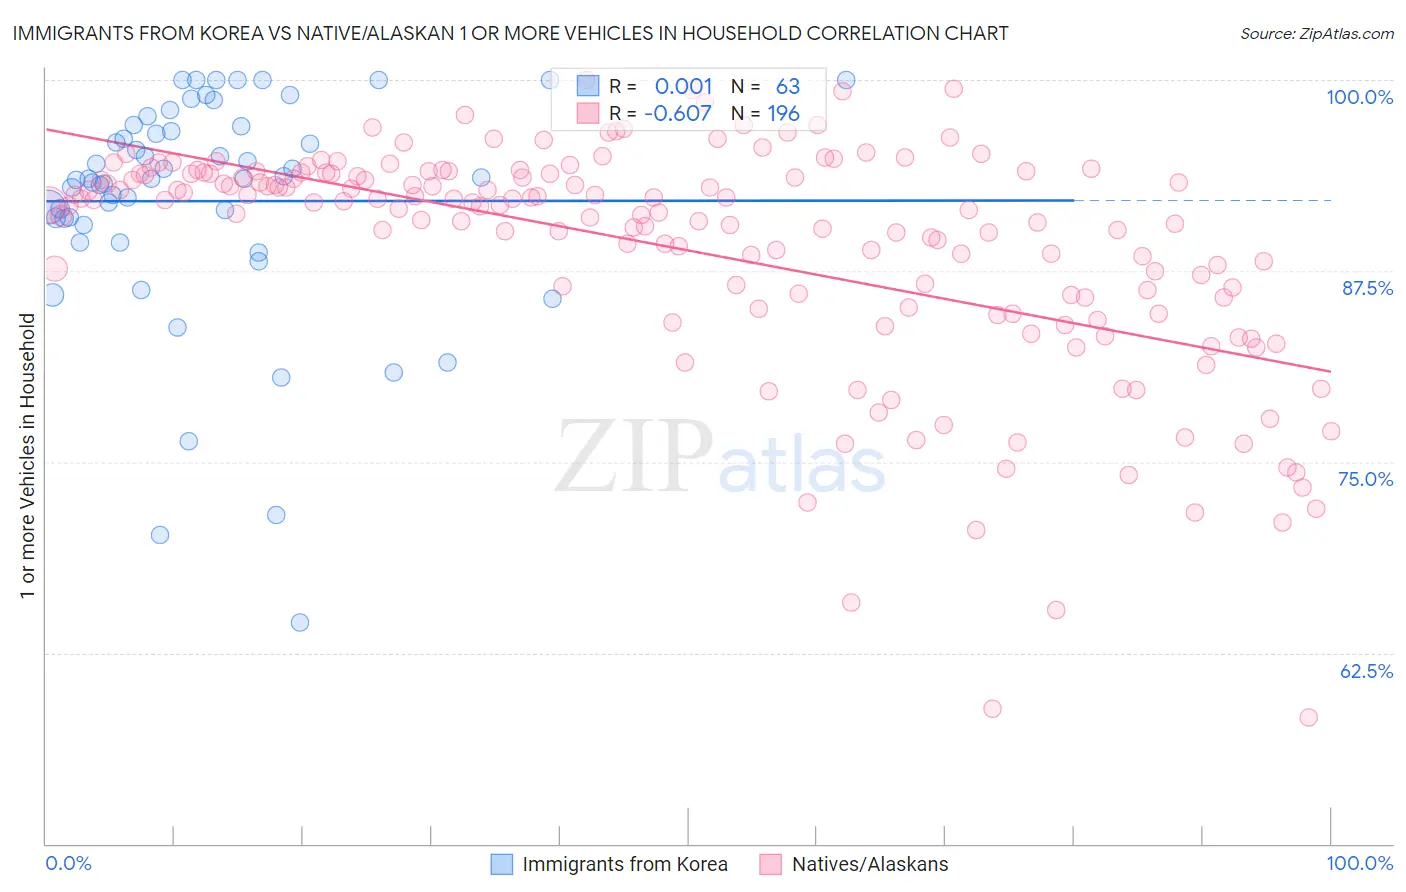
Immigrants from Korea vs Native/Alaskan 1 or more Vehicles in Household Correlation Chart
The statistical analysis conducted on geographies consisting of 416,017,081 people shows no correlation between the proportion of Immigrants from Korea and percentage of households with 1 or more vehicles available in the United States with a correlation coefficient (R) of 0.001 and weighted average of 90.5%. Similarly, the statistical analysis conducted on geographies consisting of 512,700,478 people shows a significant negative correlation between the proportion of Natives/Alaskans and percentage of households with 1 or more vehicles available in the United States with a correlation coefficient (R) of -0.607 and weighted average of 89.8%, a difference of 0.73%.
1 or more Vehicles in Household Correlation Summary
| Measurement | Immigrants from Korea | Native/Alaskan |
| Minimum | 64.5% | 58.3% |
| Maximum | 100.0% | 100.0% |
| Range | 35.5% | 41.7% |
| Mean | 92.1% | 88.9% |
| Median | 93.6% | 91.8% |
| Interquartile 25% (IQ1) | 90.5% | 85.8% |
| Interquartile 75% (IQ3) | 97.0% | 93.9% |
| Interquartile Range (IQR) | 6.5% | 8.1% |
| Standard Deviation (Sample) | 7.5% | 7.6% |
| Standard Deviation (Population) | 7.4% | 7.6% |
Similar Demographics by 1 or more Vehicles in Household
Demographics Similar to Immigrants from Korea by 1 or more Vehicles in Household
In terms of 1 or more vehicles in household, the demographic groups most similar to Immigrants from Korea are Puget Sound Salish (90.5%, a difference of 0.040%), Immigrants from Cameroon (90.4%, a difference of 0.050%), Fijian (90.5%, a difference of 0.060%), Immigrants from the Azores (90.4%, a difference of 0.060%), and Burmese (90.4%, a difference of 0.060%).
| Demographics | Rating | Rank | 1 or more Vehicles in Household |
| Japanese | 93.4 /100 | #118 | Exceptional 90.6% |
| Blackfeet | 92.6 /100 | #119 | Exceptional 90.6% |
| Immigrants | Thailand | 92.3 /100 | #120 | Exceptional 90.6% |
| Icelanders | 92.1 /100 | #121 | Exceptional 90.5% |
| Costa Ricans | 92.0 /100 | #122 | Exceptional 90.5% |
| Fijians | 91.8 /100 | #123 | Exceptional 90.5% |
| Puget Sound Salish | 91.5 /100 | #124 | Exceptional 90.5% |
| Immigrants | Korea | 90.5 /100 | #125 | Exceptional 90.5% |
| Immigrants | Cameroon | 89.4 /100 | #126 | Excellent 90.4% |
| Immigrants | Azores | 89.1 /100 | #127 | Excellent 90.4% |
| Burmese | 89.0 /100 | #128 | Excellent 90.4% |
| Marshallese | 88.9 /100 | #129 | Excellent 90.4% |
| Nicaraguans | 88.8 /100 | #130 | Excellent 90.4% |
| Immigrants | Kenya | 88.5 /100 | #131 | Excellent 90.4% |
| Immigrants | South Africa | 88.1 /100 | #132 | Excellent 90.4% |
Demographics Similar to Natives/Alaskans by 1 or more Vehicles in Household
In terms of 1 or more vehicles in household, the demographic groups most similar to Natives/Alaskans are Immigrants from Latin America (89.8%, a difference of 0.010%), Immigrants from Cambodia (89.8%, a difference of 0.010%), Immigrants from Costa Rica (89.8%, a difference of 0.030%), Immigrants from Middle Africa (89.9%, a difference of 0.040%), and Immigrants from Saudi Arabia (89.9%, a difference of 0.050%).
| Demographics | Rating | Rank | 1 or more Vehicles in Household |
| Spanish American Indians | 67.0 /100 | #162 | Good 89.9% |
| Immigrants | Austria | 65.5 /100 | #163 | Good 89.9% |
| Comanche | 63.4 /100 | #164 | Good 89.9% |
| Immigrants | Saudi Arabia | 62.6 /100 | #165 | Good 89.9% |
| Immigrants | Middle Africa | 62.2 /100 | #166 | Good 89.9% |
| Immigrants | Latin America | 60.3 /100 | #167 | Good 89.8% |
| Immigrants | Cambodia | 60.1 /100 | #168 | Good 89.8% |
| Natives/Alaskans | 59.5 /100 | #169 | Average 89.8% |
| Immigrants | Costa Rica | 57.6 /100 | #170 | Average 89.8% |
| French American Indians | 54.4 /100 | #171 | Average 89.8% |
| Indonesians | 53.0 /100 | #172 | Average 89.7% |
| Lumbee | 52.8 /100 | #173 | Average 89.7% |
| Filipinos | 50.0 /100 | #174 | Average 89.7% |
| Immigrants | Burma/Myanmar | 47.6 /100 | #175 | Average 89.7% |
| Immigrants | Sudan | 47.1 /100 | #176 | Average 89.7% |