Immigrants from Korea vs Immigrants from China Professional Degree
COMPARE
Immigrants from Korea
Immigrants from China
Professional Degree
Professional Degree Comparison
Immigrants from Korea
Immigrants from China
6.1%
PROFESSIONAL DEGREE
100.0/ 100
METRIC RATING
35th/ 347
METRIC RANK
6.7%
PROFESSIONAL DEGREE
100.0/ 100
METRIC RATING
15th/ 347
METRIC RANK
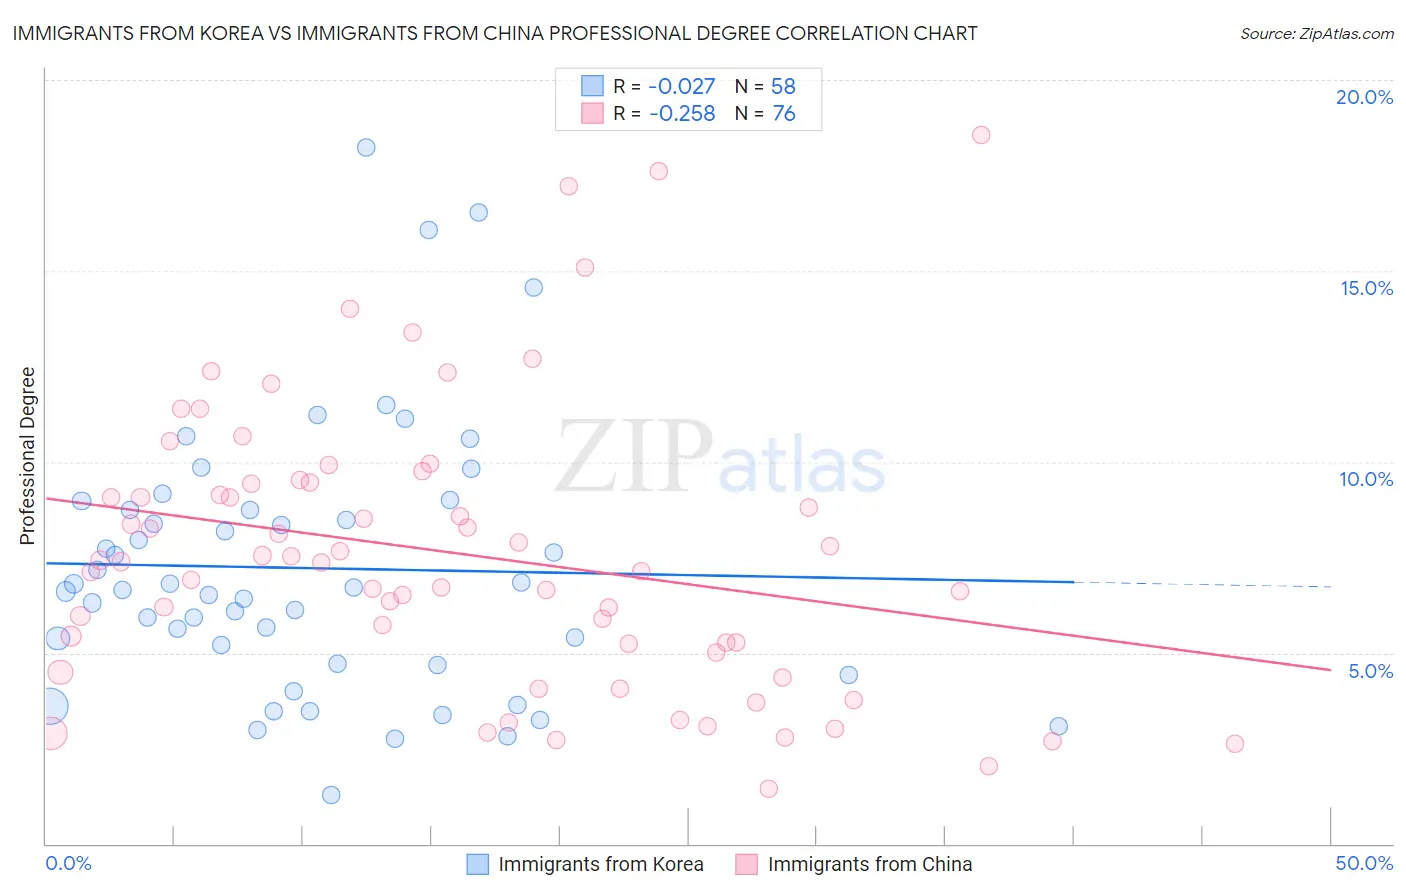
Immigrants from Korea vs Immigrants from China Professional Degree Correlation Chart
The statistical analysis conducted on geographies consisting of 415,494,018 people shows no correlation between the proportion of Immigrants from Korea and percentage of population with at least professional degree education in the United States with a correlation coefficient (R) of -0.027 and weighted average of 6.1%. Similarly, the statistical analysis conducted on geographies consisting of 455,966,204 people shows a weak negative correlation between the proportion of Immigrants from China and percentage of population with at least professional degree education in the United States with a correlation coefficient (R) of -0.258 and weighted average of 6.7%, a difference of 10.4%.
Professional Degree Correlation Summary
| Measurement | Immigrants from Korea | Immigrants from China |
| Minimum | 1.3% | 1.4% |
| Maximum | 18.2% | 18.6% |
| Range | 17.0% | 17.1% |
| Mean | 7.2% | 7.6% |
| Median | 6.7% | 7.4% |
| Interquartile 25% (IQ1) | 4.7% | 5.1% |
| Interquartile 75% (IQ3) | 8.7% | 9.5% |
| Interquartile Range (IQR) | 4.0% | 4.3% |
| Standard Deviation (Sample) | 3.5% | 3.7% |
| Standard Deviation (Population) | 3.5% | 3.7% |
Demographics Similar to Immigrants from Korea and Immigrants from China by Professional Degree
In terms of professional degree, the demographic groups most similar to Immigrants from Korea are Mongolian (6.1%, a difference of 0.66%), Burmese (6.1%, a difference of 0.80%), Thai (6.1%, a difference of 0.83%), Immigrants from India (6.2%, a difference of 1.1%), and Immigrants from Turkey (6.2%, a difference of 1.2%). Similarly, the demographic groups most similar to Immigrants from China are Immigrants from Sweden (6.7%, a difference of 0.45%), Immigrants from Eastern Asia (6.6%, a difference of 2.5%), Soviet Union (6.6%, a difference of 2.5%), Indian (Asian) (6.5%, a difference of 3.2%), and Immigrants from Denmark (6.4%, a difference of 4.8%).
| Demographics | Rating | Rank | Professional Degree |
| Immigrants | China | 100.0 /100 | #15 | Exceptional 6.7% |
| Immigrants | Sweden | 100.0 /100 | #16 | Exceptional 6.7% |
| Immigrants | Eastern Asia | 100.0 /100 | #17 | Exceptional 6.6% |
| Soviet Union | 100.0 /100 | #18 | Exceptional 6.6% |
| Indians (Asian) | 100.0 /100 | #19 | Exceptional 6.5% |
| Immigrants | Denmark | 100.0 /100 | #20 | Exceptional 6.4% |
| Immigrants | Hong Kong | 100.0 /100 | #21 | Exceptional 6.4% |
| Immigrants | Japan | 100.0 /100 | #22 | Exceptional 6.4% |
| Russians | 100.0 /100 | #23 | Exceptional 6.3% |
| Immigrants | Spain | 100.0 /100 | #24 | Exceptional 6.3% |
| Immigrants | Ireland | 100.0 /100 | #25 | Exceptional 6.3% |
| Latvians | 100.0 /100 | #26 | Exceptional 6.2% |
| Immigrants | Northern Europe | 100.0 /100 | #27 | Exceptional 6.2% |
| Turks | 100.0 /100 | #28 | Exceptional 6.2% |
| Immigrants | Sri Lanka | 100.0 /100 | #29 | Exceptional 6.2% |
| Immigrants | Turkey | 100.0 /100 | #30 | Exceptional 6.2% |
| Immigrants | India | 100.0 /100 | #31 | Exceptional 6.2% |
| Thais | 100.0 /100 | #32 | Exceptional 6.1% |
| Burmese | 100.0 /100 | #33 | Exceptional 6.1% |
| Mongolians | 100.0 /100 | #34 | Exceptional 6.1% |
| Immigrants | Korea | 100.0 /100 | #35 | Exceptional 6.1% |