Immigrants from Canada vs Immigrants from China 1 or more Vehicles in Household
COMPARE
Immigrants from Canada
Immigrants from China
1 or more Vehicles in Household
1 or more Vehicles in Household Comparison
Immigrants from Canada
Immigrants from China
91.4%
1 OR MORE VEHICLES IN HOUSEHOLD
99.2/ 100
METRIC RATING
90th/ 347
METRIC RANK
84.9%
1 OR MORE VEHICLES IN HOUSEHOLD
0.0/ 100
METRIC RATING
305th/ 347
METRIC RANK
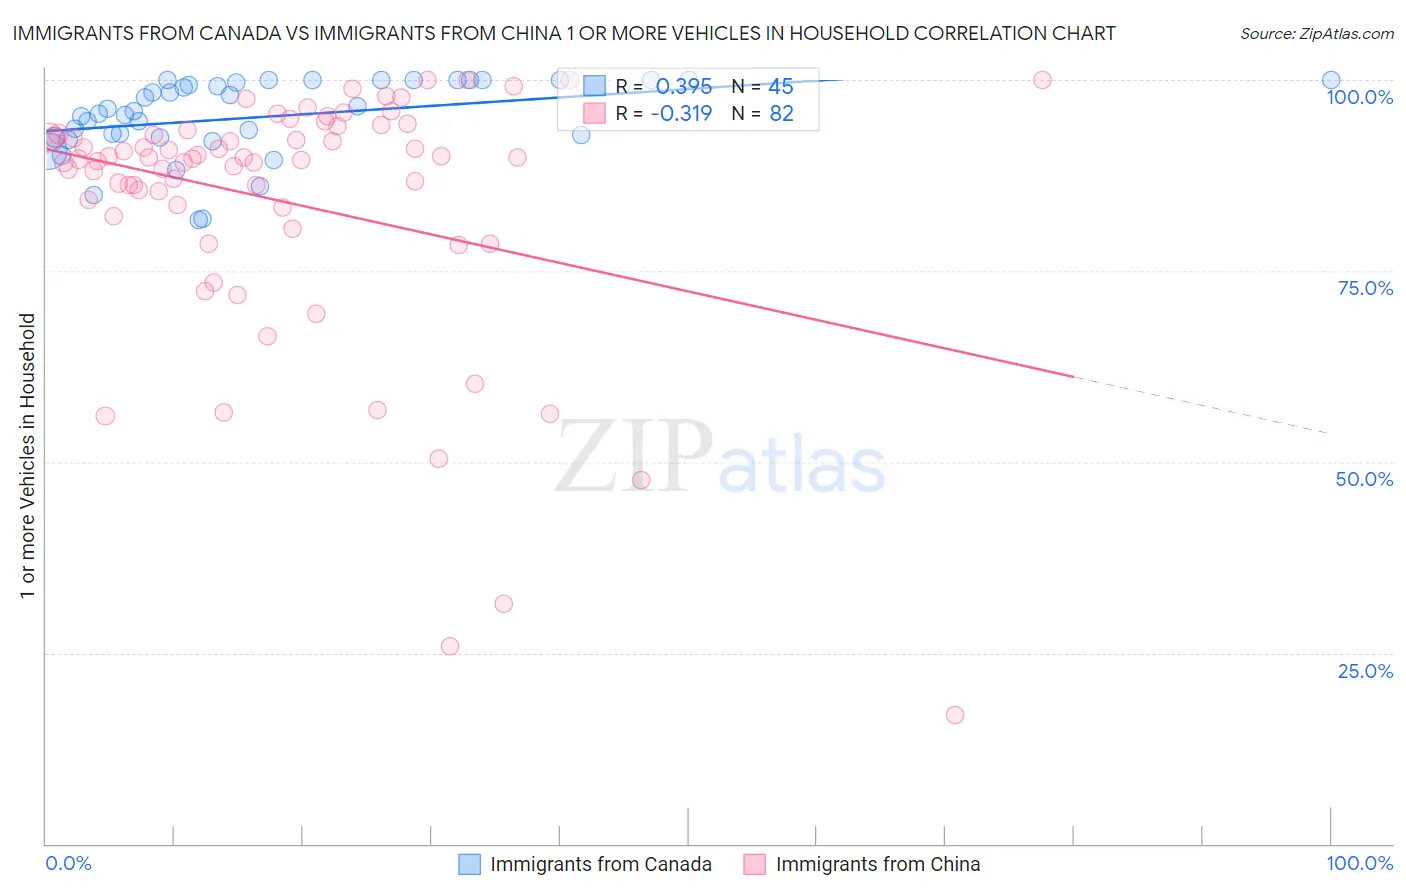
Immigrants from Canada vs Immigrants from China 1 or more Vehicles in Household Correlation Chart
The statistical analysis conducted on geographies consisting of 459,177,066 people shows a mild positive correlation between the proportion of Immigrants from Canada and percentage of households with 1 or more vehicles available in the United States with a correlation coefficient (R) of 0.395 and weighted average of 91.4%. Similarly, the statistical analysis conducted on geographies consisting of 456,603,328 people shows a mild negative correlation between the proportion of Immigrants from China and percentage of households with 1 or more vehicles available in the United States with a correlation coefficient (R) of -0.319 and weighted average of 84.9%, a difference of 7.6%.
1 or more Vehicles in Household Correlation Summary
| Measurement | Immigrants from Canada | Immigrants from China |
| Minimum | 81.6% | 16.8% |
| Maximum | 100.0% | 100.0% |
| Range | 18.4% | 83.2% |
| Mean | 95.2% | 84.0% |
| Median | 95.9% | 89.7% |
| Interquartile 25% (IQ1) | 92.5% | 83.3% |
| Interquartile 75% (IQ3) | 100.0% | 92.9% |
| Interquartile Range (IQR) | 7.5% | 9.6% |
| Standard Deviation (Sample) | 5.0% | 16.7% |
| Standard Deviation (Population) | 5.0% | 16.6% |
Similar Demographics by 1 or more Vehicles in Household
Demographics Similar to Immigrants from Canada by 1 or more Vehicles in Household
In terms of 1 or more vehicles in household, the demographic groups most similar to Immigrants from Canada are Spanish American (91.4%, a difference of 0.0%), Bangladeshi (91.4%, a difference of 0.0%), Immigrants from Jordan (91.4%, a difference of 0.0%), Immigrants from Germany (91.4%, a difference of 0.010%), and Bhutanese (91.4%, a difference of 0.010%).
| Demographics | Rating | Rank | 1 or more Vehicles in Household |
| Immigrants | England | 99.3 /100 | #83 | Exceptional 91.4% |
| Jordanians | 99.3 /100 | #84 | Exceptional 91.4% |
| Tsimshian | 99.3 /100 | #85 | Exceptional 91.4% |
| Osage | 99.2 /100 | #86 | Exceptional 91.4% |
| Immigrants | Germany | 99.2 /100 | #87 | Exceptional 91.4% |
| Spanish Americans | 99.2 /100 | #88 | Exceptional 91.4% |
| Bangladeshis | 99.2 /100 | #89 | Exceptional 91.4% |
| Immigrants | Canada | 99.2 /100 | #90 | Exceptional 91.4% |
| Immigrants | Jordan | 99.2 /100 | #91 | Exceptional 91.4% |
| Bhutanese | 99.2 /100 | #92 | Exceptional 91.4% |
| Immigrants | North America | 99.2 /100 | #93 | Exceptional 91.4% |
| Immigrants | Cuba | 99.1 /100 | #94 | Exceptional 91.3% |
| Austrians | 99.0 /100 | #95 | Exceptional 91.3% |
| Potawatomi | 99.0 /100 | #96 | Exceptional 91.3% |
| Pakistanis | 99.0 /100 | #97 | Exceptional 91.3% |
Demographics Similar to Immigrants from China by 1 or more Vehicles in Household
In terms of 1 or more vehicles in household, the demographic groups most similar to Immigrants from China are Immigrants from Western Africa (84.9%, a difference of 0.020%), Tohono O'odham (84.7%, a difference of 0.28%), Immigrants from Belize (84.7%, a difference of 0.31%), Immigrants from Haiti (84.7%, a difference of 0.32%), and Immigrants from Ukraine (85.2%, a difference of 0.34%).
| Demographics | Rating | Rank | 1 or more Vehicles in Household |
| Belizeans | 0.0 /100 | #298 | Tragic 85.7% |
| Yuman | 0.0 /100 | #299 | Tragic 85.5% |
| Immigrants | Russia | 0.0 /100 | #300 | Tragic 85.4% |
| Immigrants | Panama | 0.0 /100 | #301 | Tragic 85.4% |
| Moroccans | 0.0 /100 | #302 | Tragic 85.4% |
| Immigrants | Greece | 0.0 /100 | #303 | Tragic 85.4% |
| Immigrants | Ukraine | 0.0 /100 | #304 | Tragic 85.2% |
| Immigrants | China | 0.0 /100 | #305 | Tragic 84.9% |
| Immigrants | Western Africa | 0.0 /100 | #306 | Tragic 84.9% |
| Tohono O'odham | 0.0 /100 | #307 | Tragic 84.7% |
| Immigrants | Belize | 0.0 /100 | #308 | Tragic 84.7% |
| Immigrants | Haiti | 0.0 /100 | #309 | Tragic 84.7% |
| U.S. Virgin Islanders | 0.0 /100 | #310 | Tragic 84.6% |
| Puerto Ricans | 0.0 /100 | #311 | Tragic 84.6% |
| Cape Verdeans | 0.0 /100 | #312 | Tragic 84.5% |