Immigrants from Korea vs Immigrants from Netherlands 1 or more Vehicles in Household
COMPARE
Immigrants from Korea
Immigrants from Netherlands
1 or more Vehicles in Household
1 or more Vehicles in Household Comparison
Immigrants from Korea
Immigrants from Netherlands
90.5%
1 OR MORE VEHICLES IN HOUSEHOLD
90.5/ 100
METRIC RATING
125th/ 347
METRIC RANK
90.8%
1 OR MORE VEHICLES IN HOUSEHOLD
95.7/ 100
METRIC RATING
112th/ 347
METRIC RANK
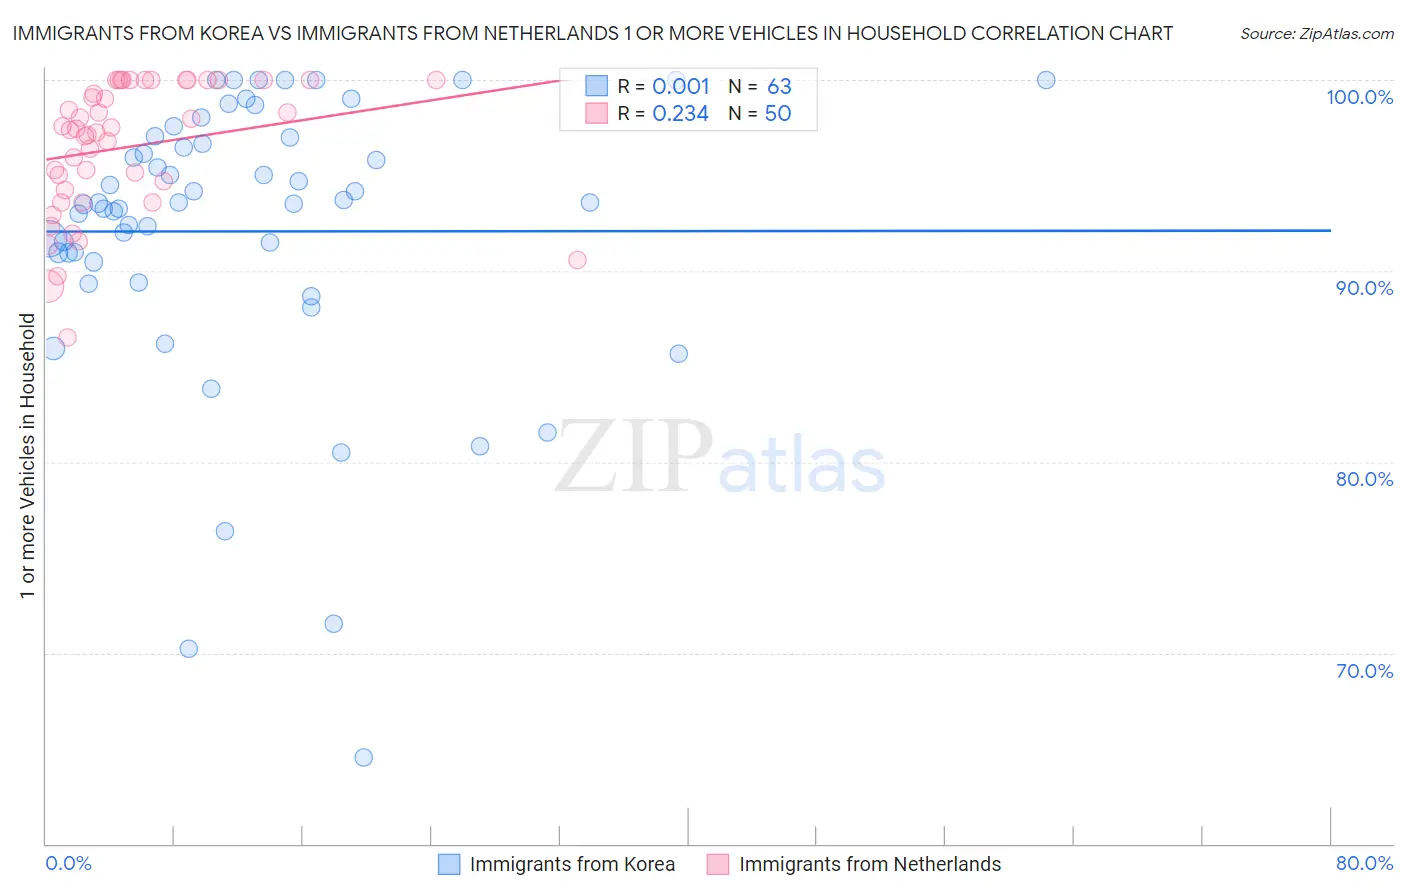
Immigrants from Korea vs Immigrants from Netherlands 1 or more Vehicles in Household Correlation Chart
The statistical analysis conducted on geographies consisting of 416,017,081 people shows no correlation between the proportion of Immigrants from Korea and percentage of households with 1 or more vehicles available in the United States with a correlation coefficient (R) of 0.001 and weighted average of 90.5%. Similarly, the statistical analysis conducted on geographies consisting of 237,818,217 people shows a weak positive correlation between the proportion of Immigrants from Netherlands and percentage of households with 1 or more vehicles available in the United States with a correlation coefficient (R) of 0.234 and weighted average of 90.8%, a difference of 0.32%.
1 or more Vehicles in Household Correlation Summary
| Measurement | Immigrants from Korea | Immigrants from Netherlands |
| Minimum | 64.5% | 86.5% |
| Maximum | 100.0% | 100.0% |
| Range | 35.5% | 13.5% |
| Mean | 92.1% | 96.5% |
| Median | 93.6% | 97.4% |
| Interquartile 25% (IQ1) | 90.5% | 94.2% |
| Interquartile 75% (IQ3) | 97.0% | 100.0% |
| Interquartile Range (IQR) | 6.5% | 5.8% |
| Standard Deviation (Sample) | 7.5% | 3.5% |
| Standard Deviation (Population) | 7.4% | 3.4% |
Demographics Similar to Immigrants from Korea and Immigrants from Netherlands by 1 or more Vehicles in Household
In terms of 1 or more vehicles in household, the demographic groups most similar to Immigrants from Korea are Puget Sound Salish (90.5%, a difference of 0.040%), Immigrants from Cameroon (90.4%, a difference of 0.050%), Fijian (90.5%, a difference of 0.060%), Immigrants from the Azores (90.4%, a difference of 0.060%), and Burmese (90.4%, a difference of 0.060%). Similarly, the demographic groups most similar to Immigrants from Netherlands are Navajo (90.8%, a difference of 0.010%), Immigrants from Kuwait (90.7%, a difference of 0.080%), Armenian (90.7%, a difference of 0.10%), Serbian (90.7%, a difference of 0.11%), and Chippewa (90.7%, a difference of 0.11%).
| Demographics | Rating | Rank | 1 or more Vehicles in Household |
| Hispanics or Latinos | 97.6 /100 | #108 | Exceptional 91.0% |
| Delaware | 97.6 /100 | #109 | Exceptional 91.0% |
| Mexican American Indians | 97.4 /100 | #110 | Exceptional 91.0% |
| Navajo | 95.8 /100 | #111 | Exceptional 90.8% |
| Immigrants | Netherlands | 95.7 /100 | #112 | Exceptional 90.8% |
| Immigrants | Kuwait | 94.7 /100 | #113 | Exceptional 90.7% |
| Armenians | 94.5 /100 | #114 | Exceptional 90.7% |
| Serbians | 94.3 /100 | #115 | Exceptional 90.7% |
| Chippewa | 94.3 /100 | #116 | Exceptional 90.7% |
| Greeks | 93.5 /100 | #117 | Exceptional 90.6% |
| Japanese | 93.4 /100 | #118 | Exceptional 90.6% |
| Blackfeet | 92.6 /100 | #119 | Exceptional 90.6% |
| Immigrants | Thailand | 92.3 /100 | #120 | Exceptional 90.6% |
| Icelanders | 92.1 /100 | #121 | Exceptional 90.5% |
| Costa Ricans | 92.0 /100 | #122 | Exceptional 90.5% |
| Fijians | 91.8 /100 | #123 | Exceptional 90.5% |
| Puget Sound Salish | 91.5 /100 | #124 | Exceptional 90.5% |
| Immigrants | Korea | 90.5 /100 | #125 | Exceptional 90.5% |
| Immigrants | Cameroon | 89.4 /100 | #126 | Excellent 90.4% |
| Immigrants | Azores | 89.1 /100 | #127 | Excellent 90.4% |
| Burmese | 89.0 /100 | #128 | Excellent 90.4% |