Immigrants from Korea vs Armenian 1 or more Vehicles in Household
COMPARE
Immigrants from Korea
Armenian
1 or more Vehicles in Household
1 or more Vehicles in Household Comparison
Immigrants from Korea
Armenians
90.5%
1 OR MORE VEHICLES IN HOUSEHOLD
90.5/ 100
METRIC RATING
125th/ 347
METRIC RANK
90.7%
1 OR MORE VEHICLES IN HOUSEHOLD
94.5/ 100
METRIC RATING
114th/ 347
METRIC RANK
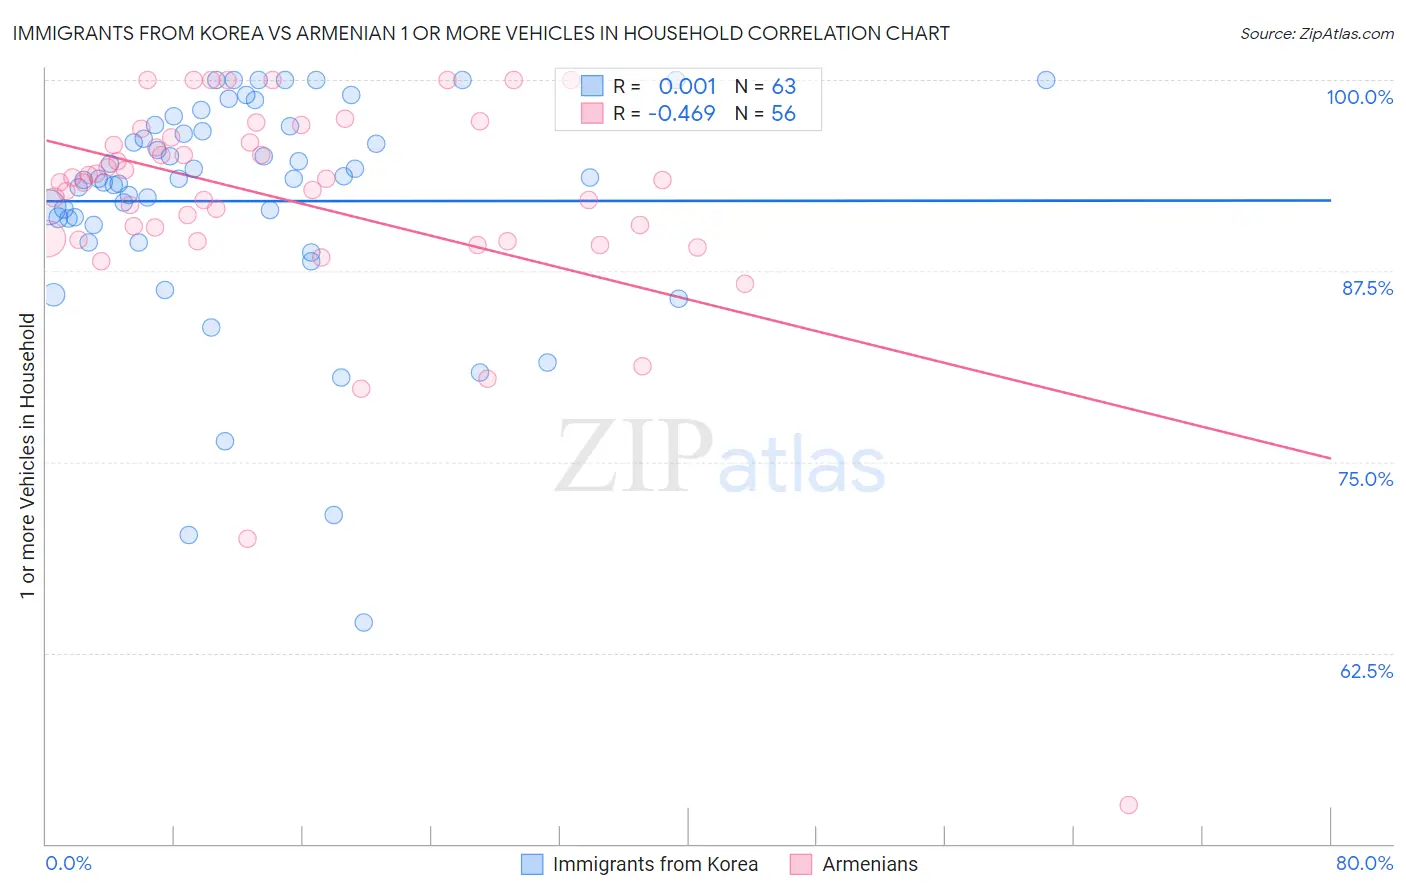
Immigrants from Korea vs Armenian 1 or more Vehicles in Household Correlation Chart
The statistical analysis conducted on geographies consisting of 416,017,081 people shows no correlation between the proportion of Immigrants from Korea and percentage of households with 1 or more vehicles available in the United States with a correlation coefficient (R) of 0.001 and weighted average of 90.5%. Similarly, the statistical analysis conducted on geographies consisting of 310,834,623 people shows a moderate negative correlation between the proportion of Armenians and percentage of households with 1 or more vehicles available in the United States with a correlation coefficient (R) of -0.469 and weighted average of 90.7%, a difference of 0.23%.
1 or more Vehicles in Household Correlation Summary
| Measurement | Immigrants from Korea | Armenian |
| Minimum | 64.5% | 52.6% |
| Maximum | 100.0% | 100.0% |
| Range | 35.5% | 47.4% |
| Mean | 92.1% | 92.0% |
| Median | 93.6% | 93.4% |
| Interquartile 25% (IQ1) | 90.5% | 89.6% |
| Interquartile 75% (IQ3) | 97.0% | 96.1% |
| Interquartile Range (IQR) | 6.5% | 6.5% |
| Standard Deviation (Sample) | 7.5% | 7.8% |
| Standard Deviation (Population) | 7.4% | 7.7% |
Demographics Similar to Immigrants from Korea and Armenians by 1 or more Vehicles in Household
In terms of 1 or more vehicles in household, the demographic groups most similar to Immigrants from Korea are Puget Sound Salish (90.5%, a difference of 0.040%), Immigrants from Cameroon (90.4%, a difference of 0.050%), Fijian (90.5%, a difference of 0.060%), Immigrants from the Azores (90.4%, a difference of 0.060%), and Burmese (90.4%, a difference of 0.060%). Similarly, the demographic groups most similar to Armenians are Immigrants from Kuwait (90.7%, a difference of 0.020%), Serbian (90.7%, a difference of 0.020%), Chippewa (90.7%, a difference of 0.020%), Greek (90.6%, a difference of 0.070%), and Japanese (90.6%, a difference of 0.080%).
| Demographics | Rating | Rank | 1 or more Vehicles in Household |
| Delaware | 97.6 /100 | #109 | Exceptional 91.0% |
| Mexican American Indians | 97.4 /100 | #110 | Exceptional 91.0% |
| Navajo | 95.8 /100 | #111 | Exceptional 90.8% |
| Immigrants | Netherlands | 95.7 /100 | #112 | Exceptional 90.8% |
| Immigrants | Kuwait | 94.7 /100 | #113 | Exceptional 90.7% |
| Armenians | 94.5 /100 | #114 | Exceptional 90.7% |
| Serbians | 94.3 /100 | #115 | Exceptional 90.7% |
| Chippewa | 94.3 /100 | #116 | Exceptional 90.7% |
| Greeks | 93.5 /100 | #117 | Exceptional 90.6% |
| Japanese | 93.4 /100 | #118 | Exceptional 90.6% |
| Blackfeet | 92.6 /100 | #119 | Exceptional 90.6% |
| Immigrants | Thailand | 92.3 /100 | #120 | Exceptional 90.6% |
| Icelanders | 92.1 /100 | #121 | Exceptional 90.5% |
| Costa Ricans | 92.0 /100 | #122 | Exceptional 90.5% |
| Fijians | 91.8 /100 | #123 | Exceptional 90.5% |
| Puget Sound Salish | 91.5 /100 | #124 | Exceptional 90.5% |
| Immigrants | Korea | 90.5 /100 | #125 | Exceptional 90.5% |
| Immigrants | Cameroon | 89.4 /100 | #126 | Excellent 90.4% |
| Immigrants | Azores | 89.1 /100 | #127 | Excellent 90.4% |
| Burmese | 89.0 /100 | #128 | Excellent 90.4% |
| Marshallese | 88.9 /100 | #129 | Excellent 90.4% |