Taiwanese vs Immigrants from Liberia 1 or more Vehicles in Household
COMPARE
Taiwanese
Immigrants from Liberia
1 or more Vehicles in Household
1 or more Vehicles in Household Comparison
Taiwanese
Immigrants from Liberia
88.4%
1 OR MORE VEHICLES IN HOUSEHOLD
2.6/ 100
METRIC RATING
241st/ 347
METRIC RANK
87.8%
1 OR MORE VEHICLES IN HOUSEHOLD
0.4/ 100
METRIC RATING
264th/ 347
METRIC RANK
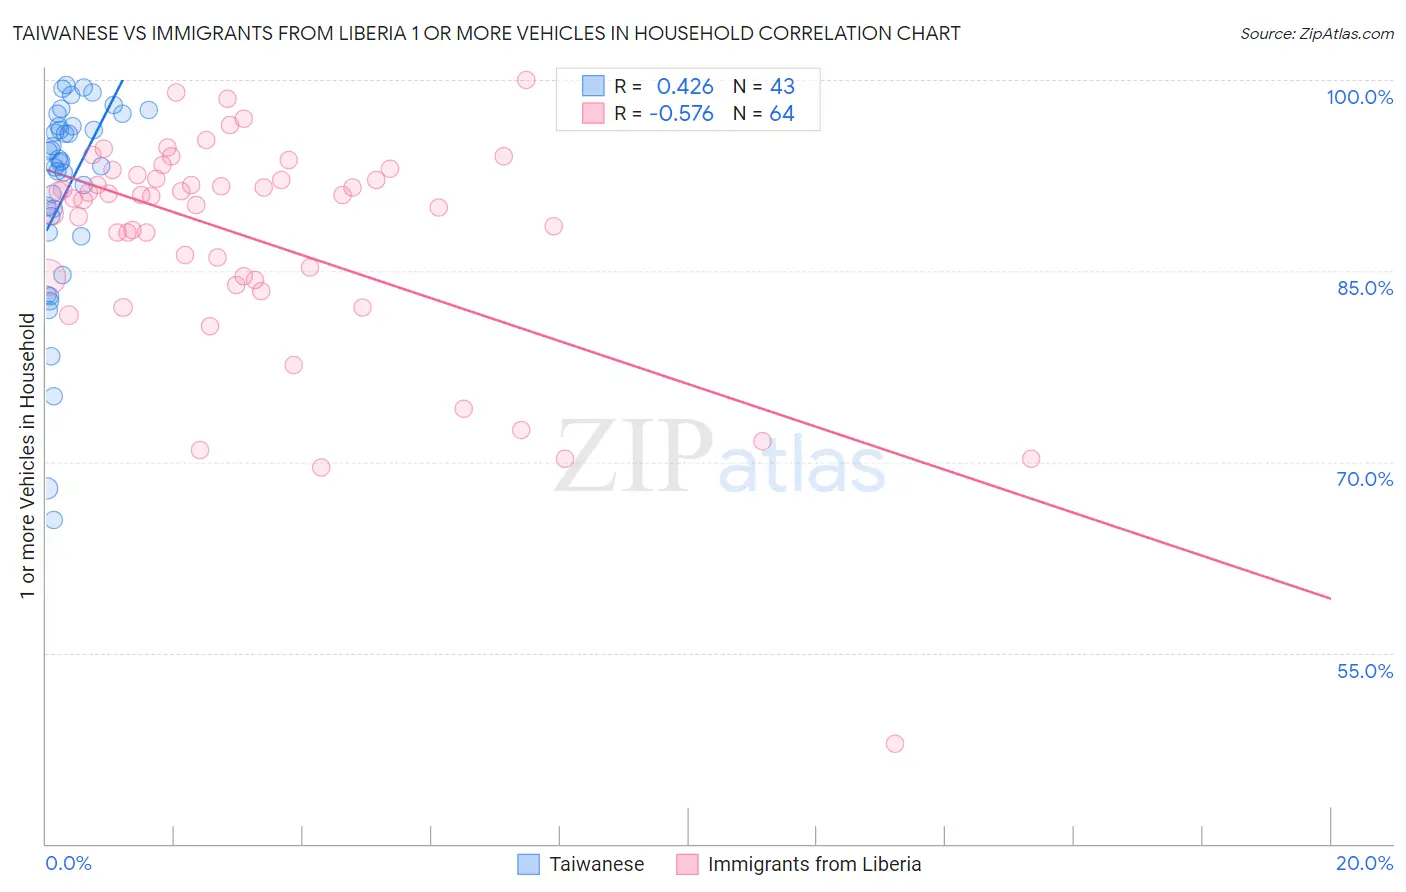
Taiwanese vs Immigrants from Liberia 1 or more Vehicles in Household Correlation Chart
The statistical analysis conducted on geographies consisting of 31,682,064 people shows a moderate positive correlation between the proportion of Taiwanese and percentage of households with 1 or more vehicles available in the United States with a correlation coefficient (R) of 0.426 and weighted average of 88.4%. Similarly, the statistical analysis conducted on geographies consisting of 135,251,590 people shows a substantial negative correlation between the proportion of Immigrants from Liberia and percentage of households with 1 or more vehicles available in the United States with a correlation coefficient (R) of -0.576 and weighted average of 87.8%, a difference of 0.72%.
1 or more Vehicles in Household Correlation Summary
| Measurement | Taiwanese | Immigrants from Liberia |
| Minimum | 65.4% | 47.9% |
| Maximum | 99.6% | 100.0% |
| Range | 34.2% | 52.1% |
| Mean | 91.2% | 87.5% |
| Median | 93.6% | 90.7% |
| Interquartile 25% (IQ1) | 88.1% | 84.4% |
| Interquartile 75% (IQ3) | 96.4% | 92.3% |
| Interquartile Range (IQR) | 8.3% | 8.0% |
| Standard Deviation (Sample) | 8.1% | 9.0% |
| Standard Deviation (Population) | 8.0% | 8.9% |
Similar Demographics by 1 or more Vehicles in Household
Demographics Similar to Taiwanese by 1 or more Vehicles in Household
In terms of 1 or more vehicles in household, the demographic groups most similar to Taiwanese are Turkish (88.4%, a difference of 0.020%), Eastern European (88.5%, a difference of 0.050%), Immigrants from Belgium (88.4%, a difference of 0.090%), Immigrants from Portugal (88.3%, a difference of 0.11%), and Immigrants from Czechoslovakia (88.3%, a difference of 0.12%).
| Demographics | Rating | Rank | 1 or more Vehicles in Household |
| Immigrants | Peru | 4.7 /100 | #234 | Tragic 88.6% |
| Paiute | 4.6 /100 | #235 | Tragic 88.6% |
| Immigrants | Pakistan | 4.5 /100 | #236 | Tragic 88.6% |
| Immigrants | Turkey | 4.4 /100 | #237 | Tragic 88.6% |
| Immigrants | Somalia | 4.2 /100 | #238 | Tragic 88.6% |
| Kiowa | 3.8 /100 | #239 | Tragic 88.6% |
| Eastern Europeans | 3.0 /100 | #240 | Tragic 88.5% |
| Taiwanese | 2.6 /100 | #241 | Tragic 88.4% |
| Turks | 2.5 /100 | #242 | Tragic 88.4% |
| Immigrants | Belgium | 2.1 /100 | #243 | Tragic 88.4% |
| Immigrants | Portugal | 2.0 /100 | #244 | Tragic 88.3% |
| Immigrants | Czechoslovakia | 1.9 /100 | #245 | Tragic 88.3% |
| Menominee | 1.9 /100 | #246 | Tragic 88.3% |
| Immigrants | Honduras | 1.7 /100 | #247 | Tragic 88.3% |
| Immigrants | Nigeria | 1.5 /100 | #248 | Tragic 88.2% |
Demographics Similar to Immigrants from Liberia by 1 or more Vehicles in Household
In terms of 1 or more vehicles in household, the demographic groups most similar to Immigrants from Liberia are Immigrants from Egypt (87.8%, a difference of 0.010%), African (87.8%, a difference of 0.020%), Subsaharan African (87.9%, a difference of 0.080%), Immigrants from Switzerland (87.9%, a difference of 0.11%), and Macedonian (87.9%, a difference of 0.15%).
| Demographics | Rating | Rank | 1 or more Vehicles in Household |
| Liberians | 0.9 /100 | #257 | Tragic 88.0% |
| South American Indians | 0.9 /100 | #258 | Tragic 88.0% |
| Nigerians | 0.8 /100 | #259 | Tragic 88.0% |
| Macedonians | 0.6 /100 | #260 | Tragic 87.9% |
| Immigrants | Switzerland | 0.6 /100 | #261 | Tragic 87.9% |
| Sub-Saharan Africans | 0.5 /100 | #262 | Tragic 87.9% |
| Immigrants | Egypt | 0.5 /100 | #263 | Tragic 87.8% |
| Immigrants | Liberia | 0.4 /100 | #264 | Tragic 87.8% |
| Africans | 0.4 /100 | #265 | Tragic 87.8% |
| Israelis | 0.3 /100 | #266 | Tragic 87.7% |
| Immigrants | Colombia | 0.3 /100 | #267 | Tragic 87.6% |
| Immigrants | Europe | 0.2 /100 | #268 | Tragic 87.6% |
| Immigrants | Africa | 0.2 /100 | #269 | Tragic 87.6% |
| Panamanians | 0.2 /100 | #270 | Tragic 87.5% |
| Bermudans | 0.2 /100 | #271 | Tragic 87.5% |