Trinidadian and Tobagonian vs Immigrants from Liberia 1 or more Vehicles in Household
COMPARE
Trinidadian and Tobagonian
Immigrants from Liberia
1 or more Vehicles in Household
1 or more Vehicles in Household Comparison
Trinidadians and Tobagonians
Immigrants from Liberia
76.3%
1 OR MORE VEHICLES IN HOUSEHOLD
0.0/ 100
METRIC RATING
332nd/ 347
METRIC RANK
87.8%
1 OR MORE VEHICLES IN HOUSEHOLD
0.4/ 100
METRIC RATING
264th/ 347
METRIC RANK
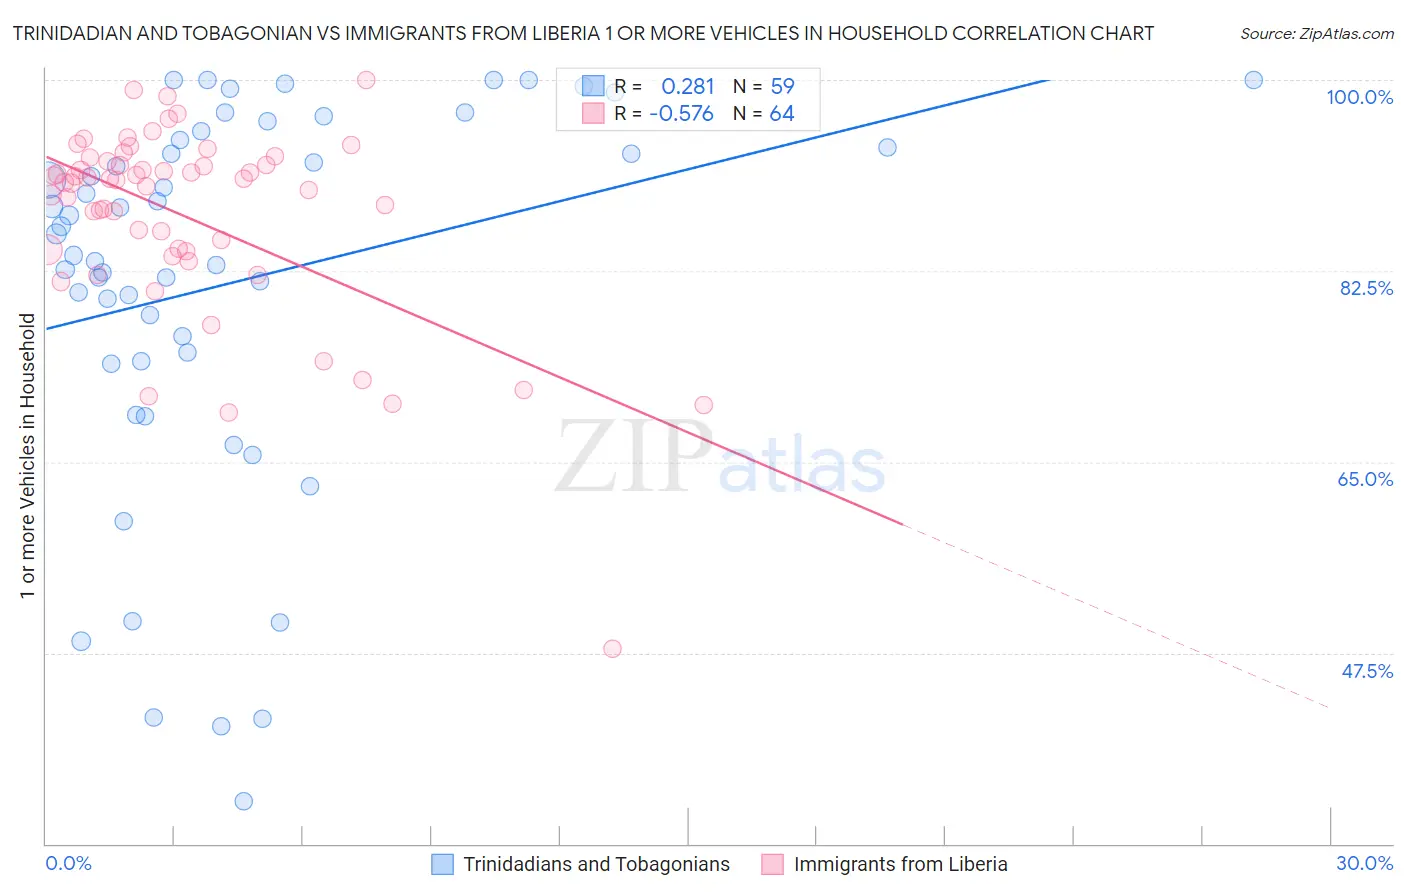
Trinidadian and Tobagonian vs Immigrants from Liberia 1 or more Vehicles in Household Correlation Chart
The statistical analysis conducted on geographies consisting of 219,744,426 people shows a weak positive correlation between the proportion of Trinidadians and Tobagonians and percentage of households with 1 or more vehicles available in the United States with a correlation coefficient (R) of 0.281 and weighted average of 76.3%. Similarly, the statistical analysis conducted on geographies consisting of 135,251,590 people shows a substantial negative correlation between the proportion of Immigrants from Liberia and percentage of households with 1 or more vehicles available in the United States with a correlation coefficient (R) of -0.576 and weighted average of 87.8%, a difference of 15.1%.
1 or more Vehicles in Household Correlation Summary
| Measurement | Trinidadian and Tobagonian | Immigrants from Liberia |
| Minimum | 33.9% | 47.9% |
| Maximum | 100.0% | 100.0% |
| Range | 66.1% | 52.1% |
| Mean | 81.5% | 87.5% |
| Median | 85.9% | 90.7% |
| Interquartile 25% (IQ1) | 74.2% | 84.4% |
| Interquartile 75% (IQ3) | 94.5% | 92.3% |
| Interquartile Range (IQR) | 20.3% | 8.0% |
| Standard Deviation (Sample) | 17.3% | 9.0% |
| Standard Deviation (Population) | 17.2% | 8.9% |
Similar Demographics by 1 or more Vehicles in Household
Demographics Similar to Trinidadians and Tobagonians by 1 or more Vehicles in Household
In terms of 1 or more vehicles in household, the demographic groups most similar to Trinidadians and Tobagonians are West Indian (76.4%, a difference of 0.080%), Immigrants from Ecuador (76.2%, a difference of 0.10%), Immigrants from Trinidad and Tobago (76.8%, a difference of 0.64%), Immigrants from Dominica (77.8%, a difference of 2.0%), and Ecuadorian (77.9%, a difference of 2.1%).
| Demographics | Rating | Rank | 1 or more Vehicles in Household |
| Senegalese | 0.0 /100 | #325 | Tragic 80.4% |
| Immigrants | West Indies | 0.0 /100 | #326 | Tragic 79.5% |
| Immigrants | Senegal | 0.0 /100 | #327 | Tragic 79.0% |
| Ecuadorians | 0.0 /100 | #328 | Tragic 77.9% |
| Immigrants | Dominica | 0.0 /100 | #329 | Tragic 77.8% |
| Immigrants | Trinidad and Tobago | 0.0 /100 | #330 | Tragic 76.8% |
| West Indians | 0.0 /100 | #331 | Tragic 76.4% |
| Trinidadians and Tobagonians | 0.0 /100 | #332 | Tragic 76.3% |
| Immigrants | Ecuador | 0.0 /100 | #333 | Tragic 76.2% |
| Immigrants | Bangladesh | 0.0 /100 | #334 | Tragic 74.3% |
| Barbadians | 0.0 /100 | #335 | Tragic 74.0% |
| Vietnamese | 0.0 /100 | #336 | Tragic 73.8% |
| Immigrants | Uzbekistan | 0.0 /100 | #337 | Tragic 73.4% |
| Inupiat | 0.0 /100 | #338 | Tragic 71.5% |
| Guyanese | 0.0 /100 | #339 | Tragic 70.8% |
Demographics Similar to Immigrants from Liberia by 1 or more Vehicles in Household
In terms of 1 or more vehicles in household, the demographic groups most similar to Immigrants from Liberia are Immigrants from Egypt (87.8%, a difference of 0.010%), African (87.8%, a difference of 0.020%), Subsaharan African (87.9%, a difference of 0.080%), Immigrants from Switzerland (87.9%, a difference of 0.11%), and Macedonian (87.9%, a difference of 0.15%).
| Demographics | Rating | Rank | 1 or more Vehicles in Household |
| Liberians | 0.9 /100 | #257 | Tragic 88.0% |
| South American Indians | 0.9 /100 | #258 | Tragic 88.0% |
| Nigerians | 0.8 /100 | #259 | Tragic 88.0% |
| Macedonians | 0.6 /100 | #260 | Tragic 87.9% |
| Immigrants | Switzerland | 0.6 /100 | #261 | Tragic 87.9% |
| Sub-Saharan Africans | 0.5 /100 | #262 | Tragic 87.9% |
| Immigrants | Egypt | 0.5 /100 | #263 | Tragic 87.8% |
| Immigrants | Liberia | 0.4 /100 | #264 | Tragic 87.8% |
| Africans | 0.4 /100 | #265 | Tragic 87.8% |
| Israelis | 0.3 /100 | #266 | Tragic 87.7% |
| Immigrants | Colombia | 0.3 /100 | #267 | Tragic 87.6% |
| Immigrants | Europe | 0.2 /100 | #268 | Tragic 87.6% |
| Immigrants | Africa | 0.2 /100 | #269 | Tragic 87.6% |
| Panamanians | 0.2 /100 | #270 | Tragic 87.5% |
| Bermudans | 0.2 /100 | #271 | Tragic 87.5% |